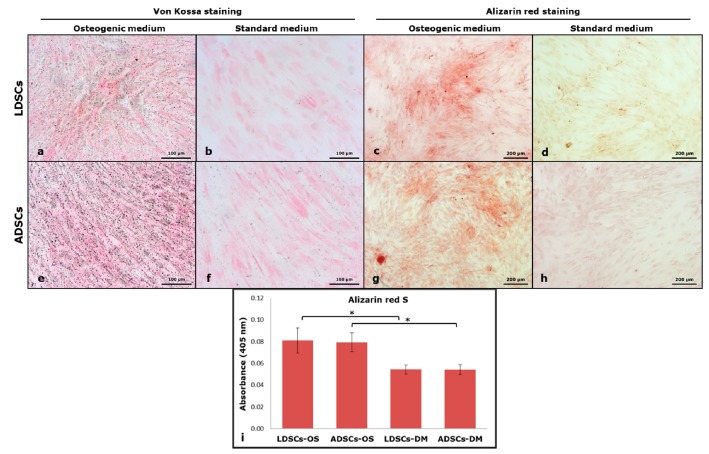
Figure 10.
Von Kossa staining of cells at day 16 of osteogenic differentiation; LDSCs in osteogenic medium (OS) (a) LDSCs in standard medium (DM) (b) ADSCs in OS medium (e) and ADSCs in DM medium (f); dark grey/black deposits’ color in (a) and (e) indicates positive staining; Alizarin red S staining of cells at day 16 of osteogenic differentiation; LDSCs in OS medium (c) LDSCs in DM medium (d) ADSCs in OS medium (g) and ADSCs in DM medium (h); red deposits’ color in (c) and (g) indicates positive Alizarin red S (ARS)staining; All images were acquired at bright field with objective magnification 10×; quantitative measurement of ARS dye (i), presented as mean ± SD, n (LDSCs) = 5 and n (ADSCs) = 4 for all groups; (*) p < 0.05.

