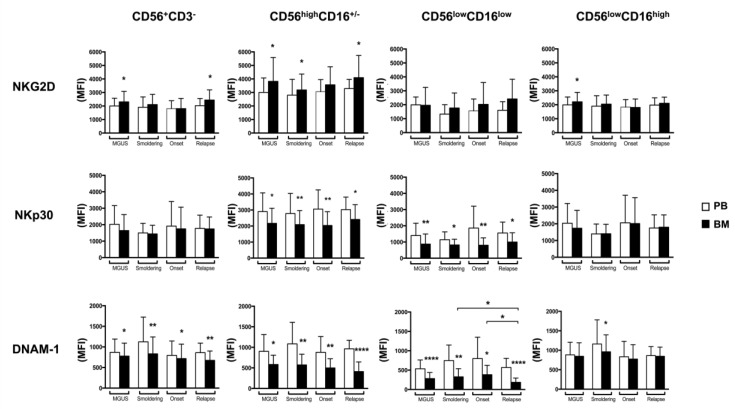
Figure 2.
BM and PB NK cell subsets receptor profile of MM patients during disease progression. FACS analysis of surface expression of NKG2D (A), NKp30 (B) and DNAM-1 (C) on total NK cells and NK cell subsets in PB (white histograms) and BM (black histograms) of MM patients at different state disease (MGUS, n = 19; Smoldering, n = 18; Onset, n = 18; Relapse, n = 17) was shown. Values are expressed as mean of mean fluorescence intensity (MFI) and error bars represent SD. **** p < 0.0001; ** p < 0.01; * p < 0.05.

