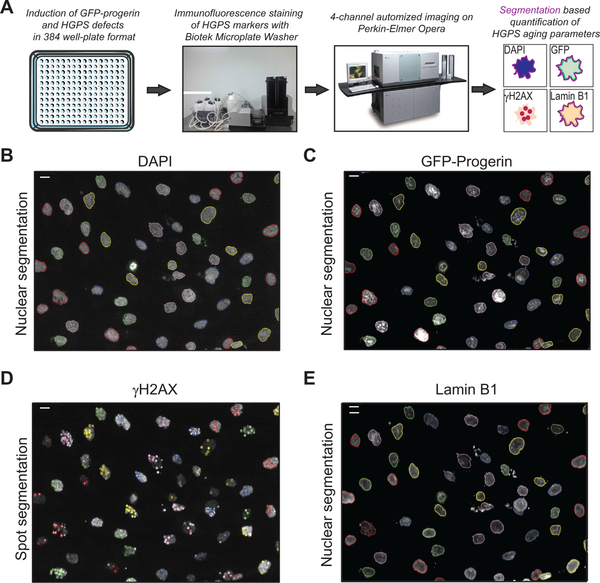
Fig. 2.
High-content imaging quantification of HGPS defects. (A) Schematic representation of the pipeline used for automated detection and quantification of HGPS defects in GFP-progerin inducible fibroblasts. (B, C, E) Representative image of nuclear segmentation based on the DNA DAPI signal in GFP-progerin inducible fibroblasts (4 days, 1 μg/ml doxycycline), shown for DAPI stain (A), GFP-progerin (B) and lamin B1 IF staining (D); scale bar: 10 μM. (D) Example of contrast-based segmentation of γH2AX foci in GFP-progerin inducible fibroblasts (4 days, 1 μg/ml doxycycline). Scale bar: 10 μM.

