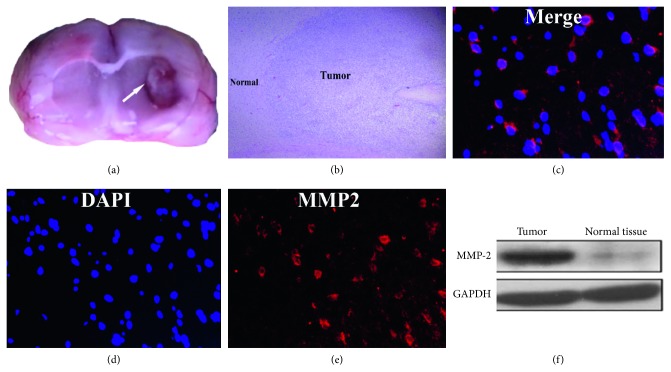
Figure 6.
(a) The gross pathology of the glioma in the rat brain; (b) HE staining showing a clear boundary between tumor parenchyma and normal brain tissue; (c–e) the immunofluorescence image showing the MMP-2 expression in C6 glioma cells; (f) the western blot analysis showing that MMP-2 was upregulated in the tumor, compared with normal brain parenchyma.

