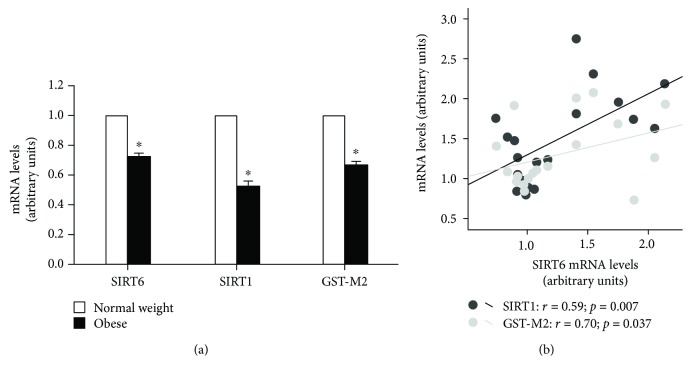
Figure 1.
Liver expression of SIRT6, SIRT1, and GST-M2 genes in lean or obese rats (a). Data are represented as the mean ± standard error of the mean (SEM). Statistically significant differences compared with control-lean counterparts ∗ p < 0.05 vs. normal weight group. Association between SIRT6 mRNA levels with SIRT1 or GST-M2 genes in all animal taking together (b). SIRT1 (r = 0.59; p = 0.007), GST-M2 (r = 0.70; p = 0.037).

