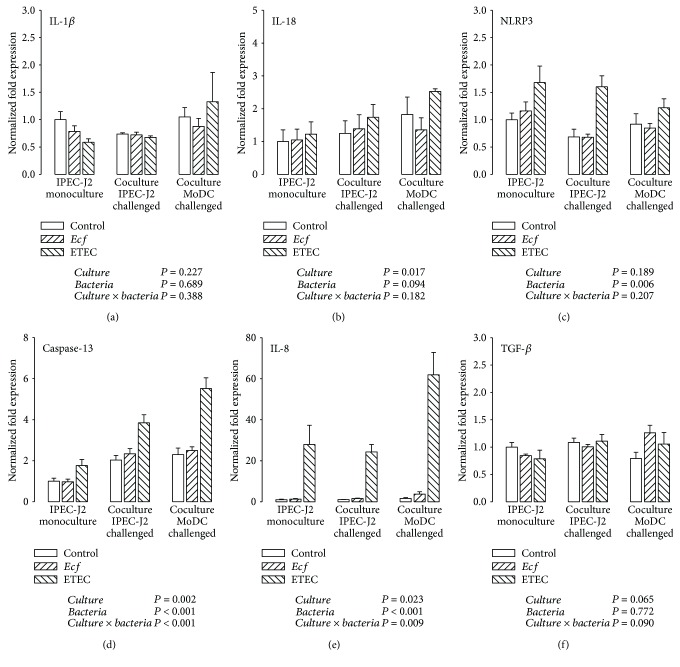
Figure 3.
mRNA expression of (a) IL-1β, (b) IL-18, (c) NLRP3, (d) caspase-13, (e) IL-8, and (f) TGF-β in IPEC-J2 cells after stimulation with either E. faecium (Ecf) or ETEC. In IPEC-J2/MoDC cocultures, Ecf or ETEC was added either to the apical side of IPEC-J2 cells or to the MoDC compartment. In IPEC-J2 monocultures, the bacteria were added to the apical compartment. Samples were taken at 6 h after addition of bacteria (means ± SEM). N = 4 independent experiments per bar. Normalized fold expression was calculated by the ΔΔCt method. Results of the ANOVA are indicated below each graph. Results of post hoc tests are presented in Supplementary Table 2.

