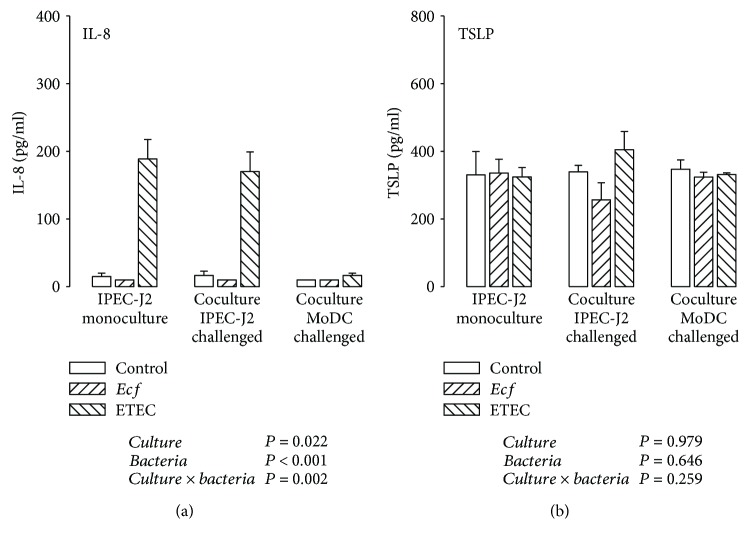
Figure 5.
Protein expression (in pg/ml) of (a) IL-8 and (b) TSLP detected by ELISA in supernatants of IPEC-J2 cells after stimulation with either E. faecium (Ecf) or ETEC. In IPEC-J2/MoDC cocultures, Ecf or ETEC was added either to the apical side of IPEC-J2 cells or to the MoDC compartment. In IPEC-J2 monocultures, the bacteria were added to the apical compartment. Samples were taken at 6 h after addition of bacteria (means ± SEM). N = 3 independent experiments per bar. Results of the ANOVA are indicated below each graph. Results of post hoc tests are presented in Supplementary Table 4.

