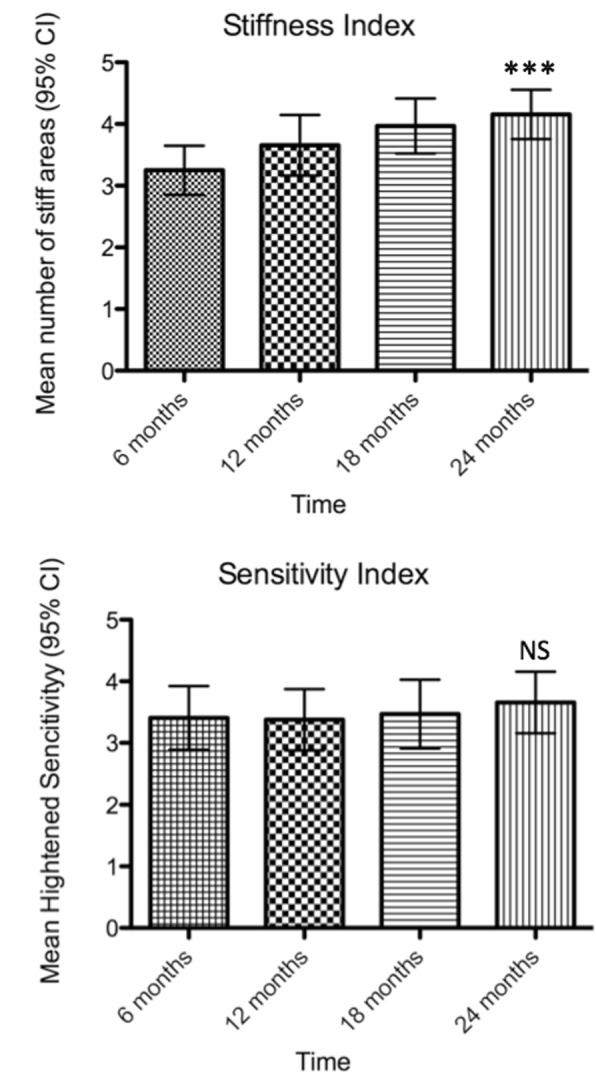
Fig. 1.

Analysis of stiffness and heightened sensitivity indices for the 32 serially analyzed patients over a 2-year course. a: Mean number of stiff areas at 6 months intervals. There is a statistically significant increase (p < 0.0001, Friedman test – One way ANOVA) in the number of stiff areas (3.25 at 6 months rising to 4.15 at 24 months) during the observation period. b: Mean number of heightened sensitivity scores calculated at 6 months intervals. The observed increase (3.40 vs 3.65) is not statistically significant (p < 0.1195, Friedman test – One way ANOVA)
