Fig. 8.
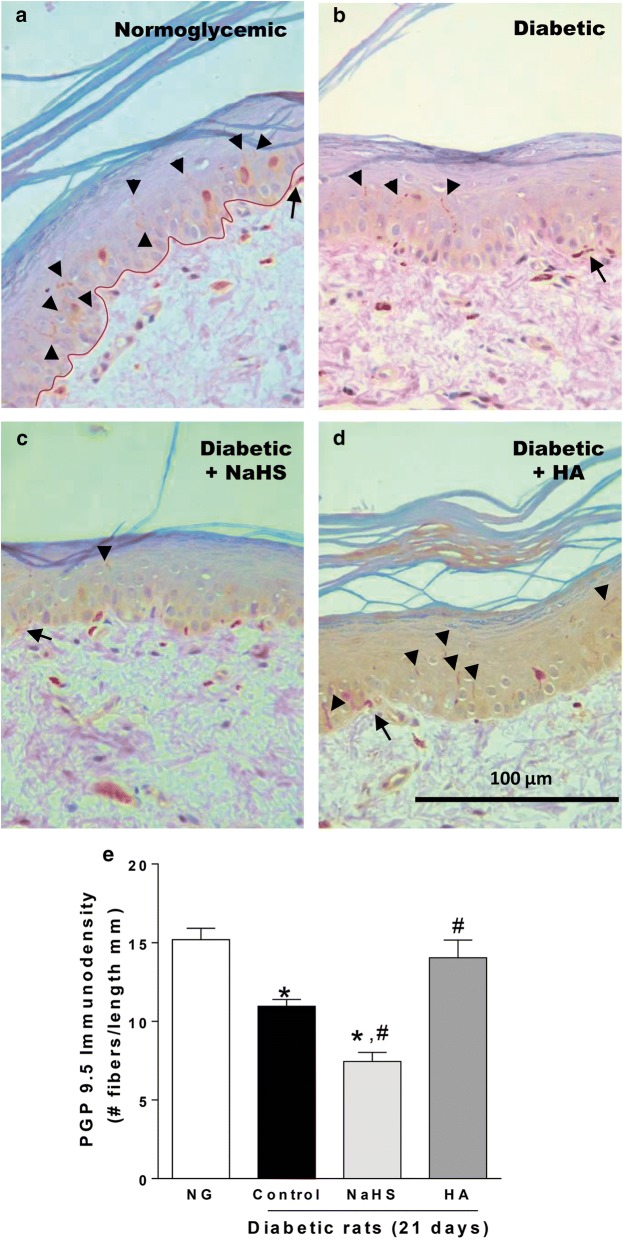
Representative images for skin sections immunostained with PGP 9.5 to reveal the innervation of intraepidermal (black arrowheads) and subepidermal nerve fibers (black arrows) at × 40 magnification. a Sections in normoglycemic rats show abundant epidermal nerve profiles, b whereas sections in diabetic rats reveal a decrease in nerve fibers. c Daily NaHS treatment (a donor of H2S; 100 μg/paw, 21 days, s.c.) enhances diabetes-induced nerve fiber loss. On the contrary, d daily subcutaneous hydroxylamine (a CBS enzyme inhibitor [HA]; 0.1 μg/paw, 21 days) partially reversed the diabetes-induced nerve fiber loss. Bars are represented as the mean of the number of nerve fibers counted per mm of epidermis ± SEM of 5 animals for each treatment. *Significantly different from normoglycemic (NG) group and #significantly different from control (diabetic rats) group (P < 0.05) determined by one-way ANOVA followed by the Student–Newman–Keuls’ test. Red line separate epidermis to dermis

