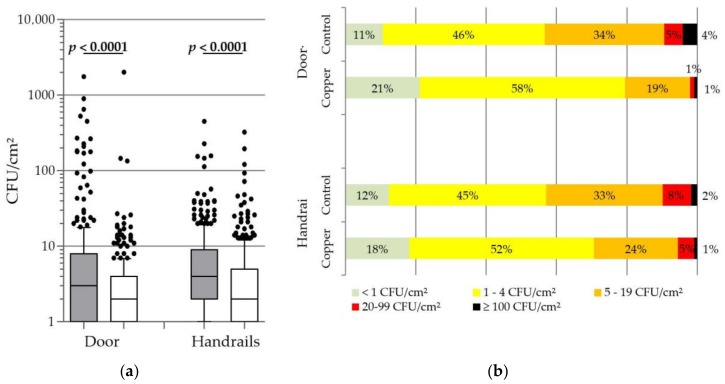
Figure 1.
Distribution of the environmental bacterial burden found on touch surfaces. Overall compilation for the five long term care facilities. (a) Box plot representation of all the values. Grey boxes, control; White boxes, copper. Horizontal line in box, median; Boxes extremities, 1–4 quartiles; Whiskers, 10–90 percentiles; dots, 10% highest values; Significant p-value of Mann-Whitney U test are noted in bold. (b) Frequency distribution of the bacterial burden concentration (%). Door handles: n = 341. Handrails: n = 347.

