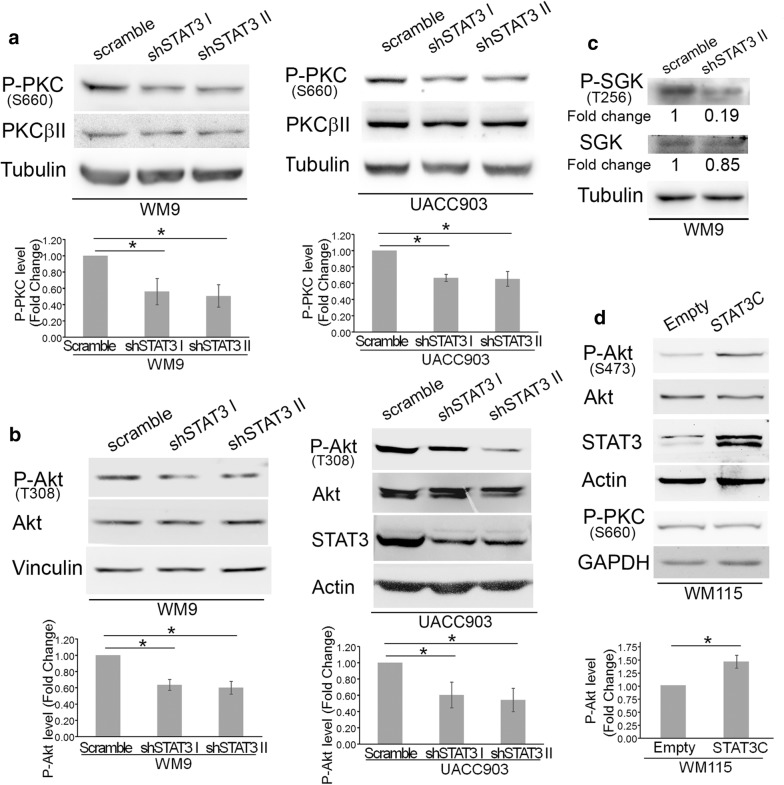
Fig. 3.
STAT3 silencing reduced PKC, Akt, and SGK phosphorylation. Protein extracts from WM9 and UACC903 cells described in Fig. 2. were assayed in Western blot to determine PKC a, Akt b and SGK c phosphorylation. a, b A P-Pan-PKC antibody against Ser660 was used. Total PKC was estimated by using a PKCβII antibody. Tubulin, Vinculin and Actin were used as loading controls. The blots displayed are representative of three independent experiments. Bar graphs show the mean ± S.D. (from three independent experiments) of P-PKC a and P-Akt b levels normalized to the corresponding total protein level and expressed as the fold change relative to scramble cells. Statistical significance was tested by one-tailed Student’s T-Test using log transformed FC values. *p < 0.01, n = 5. c WM9 extracts described above were probed with the indicated antibodies. Protein levels after STAT3 silencing were normalized to the corresponding total protein level and expressed as the fold change (numbers below the blots) relative to scramble cells. The blots displayed are representative of two independent experiments. d STAT3C increased P-Akt levels. Protein extracts from WM115 cells stably transfected with STAT3C were probed with the indicated antibodies. GAPDH was used as a loading control. Bar graph shows the mean ± S.D. (from three independent experiments) of P-Akt levels normalized to the corresponding total protein level and expressed as the fold change relative to Empty cells. Statistical significance was tested by one-tailed Student’s T-Test using log transformed FC values. *p < 0.01, n = 3

