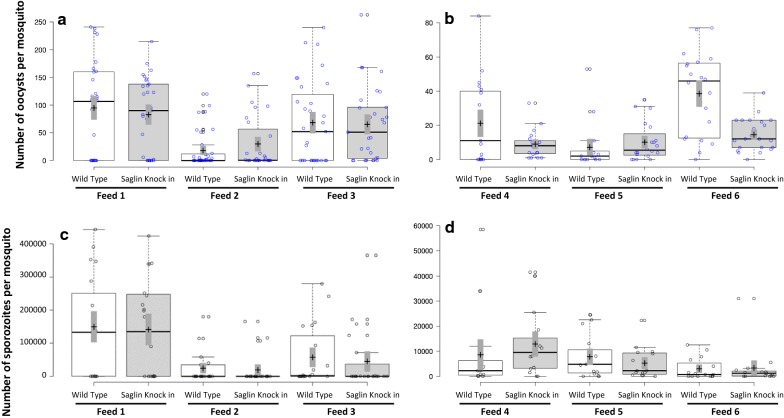
Fig. 6.
Plasmodium falciparum infection characteristics in wild type and Saglin knock in transgenic Anopheles stephensi. Results of six experimental feeds in two experiments a, c and b, d), each data point showing the number of oocysts (a, b) and PfSPZ (c, d) per mosquito. Center lines show the medians; box limits indicate the 25th and 75th percentiles as determined by R software; whiskers extend 1.5 times the interquartile range from the 25th and 75th percentiles; crosses represent sample means; bars indicate 83% confidence intervals of the means; data points are plotted as open circles

