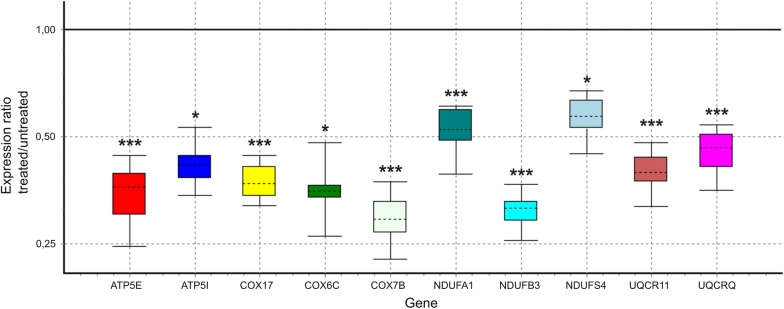
Fig. 3.
RT-qPCR analysis of selected, OXPHOS-related differentially expressed genes. Here we show relative (GO-treated vs. control cells) expression of given gene. Expression values for the given gene were first normalized to expression values of reference genes, and then compared between experimental groups. Expression ratios were calculated using the REST 2009 software tool. Results are presented as whisker-box plots where the box area encompasses 50% of all observations, the dashed line represents the sample median and the whiskers represent the outer 50% of observations. The black solid line defines the value of no change in relative expression. Statistical significance: *p < 0.05, ***p < 0.001

