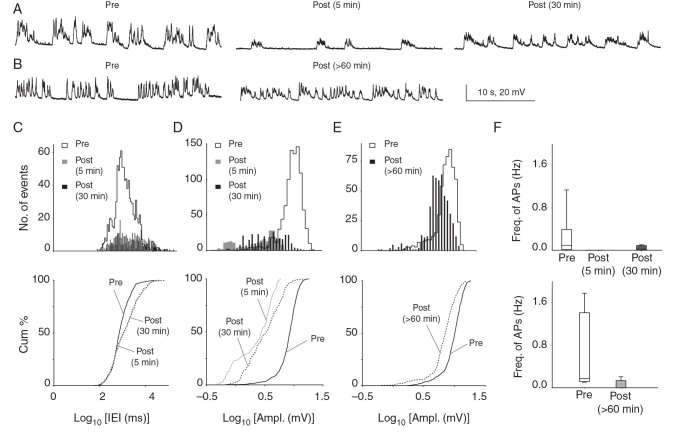
Figure 3.
Significant reductions in spontaneous synaptic activity and AP firing >1 h after CSD in vivo. ( A ) Consecutive membrane voltage traces (30 s) from continuous recordings of sPSPs before, and 5 and 30 min after CSD from the same cell. There is a dramatic reduction in sPSP amplitude and frequency 5 min after CSD, which recovers but remains below baseline 30 min after the event. ( B ) Similar traces comparing a cell patched before CSD to a separate cell patched >60 min after CSD in the same animal. ( C , D ) sPSP amplitude and frequency were significantly reduced 5 and 30 min after CSD when recorded from the same cell. (Histograms above; cumulative plots below. Amplitude: 5 min: P = 2.01 × 10 −12 ; 30 min: P = 2.77 × 10 −8 , 2-sample KS test; Frequency: 5 min: P = 3.78 × 10 −8 ; 30 min: P = 4.59 × 10 −10 , 2-sample KS test; n = 6 cells, 6 mice). Similar changes were seen at 30 min comparing cells recorded before to separate cells recorded 30 min after CSD from the same animal (see Supplementary Fig. 3 ) showing that findings were not due to rundown of whole-cell recordings. ( E ) Recordings comparing cells recorded before with separate cells recorded >60 min after CSD in the same animal: there was no significant difference in sPSP frequency at this time point ( P > 0.05, 5 cells, 5 mice, 2-sample KS test; not shown); however, amplitude of PSPs remained reduced for at least 90 min after CSD ( P = 3.86 × 10 −40 ; 5 cells, 5 mice; 2-sample KS test). ( F ) Box–whisker plot showing no AP firing at 5 min post-CSD and significantly reduced AP firing 30 (upper panel) and >60 min post-CSD (lower panel).

