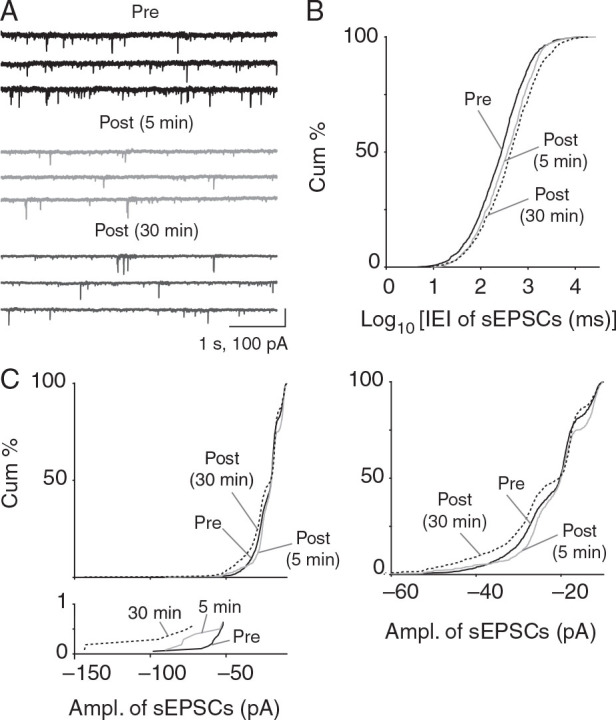
Figure 4.

Reduced frequency and mixed effects on sEPSC amplitude after CSD in vitro. ( A ) sEPSCs recorded in Layer 2/3 pyramidal neurons at 5 and 30 mins post-CSD. ( B ) sEPSC frequency is consistently decreased 5 and 30 min after CSD (lengthened interevent interval, rightward shift as shown in cumulative plots; 5 min: P = 1.62 × 10 −8 , 30 min: P = 2.17 × 10 −15 ; 2 sample KS test; 5 min post-CSD, n = 5 cells, 5 mice and 30 min post-CSD, n = 7 cells, 7 mice). ( C ) sEPSC amplitude was decreased at 5 min post-CSD ( P = 3.02 × 10 −4 ; KS test) but increased at 30 min ( P = 1.72 × 10 −4 ; 2-sample KS test; 5 min post-CSD: n = 5 cells, 5 mice and 30 min post-CSD: n = 7 cells, 7 mice). Magnified cumulative plot below shows large amplitude events (greater than −70 pA) that were only evident in post-CSD groups. Magnified cumulative plot on right including only less than −60 pA events shows clear rightward shift (smaller amplitudes) at 5 min and leftward shift (larger amplitudes) 30 min after CSD.
