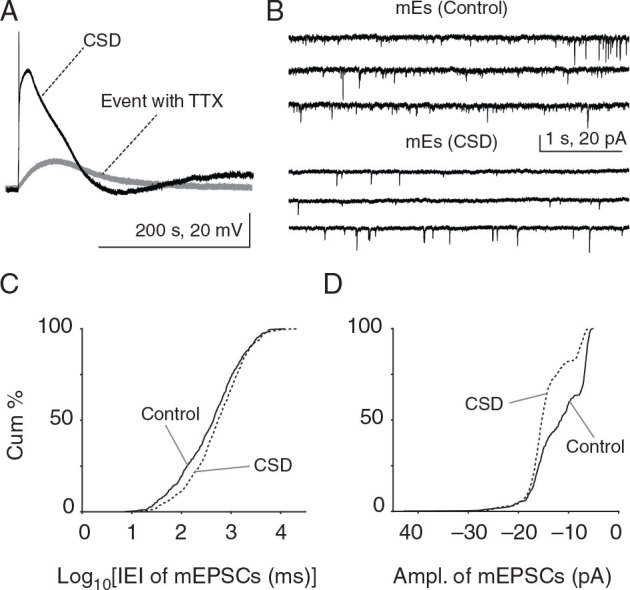
Figure 5.

Reduced frequency and increased amplitude of mEPSCs after CSD in vitro. ( A ) Whole-cell recordings were made at −70 mV in current clamp mode to record membrane potential changes during CSD. Typical CSD depolarization of a Layer 2/3 pyramidal cell showing significantly reduced membrane potential changes during KCl-induced depolarization with TTX treatment (50.59 ± 6.41 mV vs. event with TTX: 20.27 ± 4.91 mV). There was no change in mEPSC frequency or amplitude after CSD induced in the presence of TTX ( P > 0.05, 2-sample KS test; n = 4 cells, 4 mice; data not shown). ( B ) mEPSCs from separate post-CSD and control groups in different slices from the same animal, where TTX was delivered after CSD (or sham CSD—NaCl ejection—in control groups). ( C , D ) There was a significant decrease in mEPSC frequency (rightward shift in cumulative plot; P = 1.7 × 10 −4 , 2-sample KS test; control: n = 4 cells, 4 mice and CSD: n = 6 cells, 6 mice) and a significant increase in mEPSC amplitude 30 min post-CSD (leftward shift toward larger amplitudes; P = 1.31 × 10 −31 ; KS test; control: n = 4 cells, 4 mice and CSD: n = 6 cells, 6 mice) after “intact” CSD.
