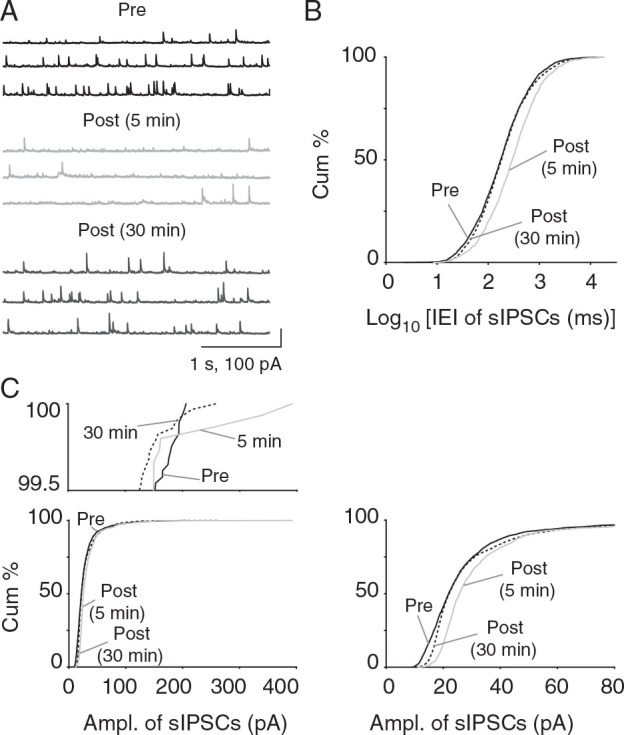
Figure 6.

Reduced frequency and consistently increased amplitude of sIPSCs after CSD in vitro. ( A ) Voltage-clamp recordings of sIPSCs from Layer 2/3 pyramidal cells after CSD. Note the increase in amplitude of IPSCs post-CSD. ( B ) There was a significant reduction in sIPSC frequency 5 min post-CSD (rightward shift towards longer intervals; P = 3.13 × 10 −28 ; 2-sample KS test; 5 min post-CSD: n = 8 cells, 8 mice and 30 min post-CSD: n = 9 cells, 9 mice) but not 30 min after CSD ( P = 0.09; 2-sample KS test). ( C ) Consistent increase in sIPSC amplitude 5 and 30 min after CSD (5 min post-CSD: P = 1.67 × 10 −64 , 30 min post-CSD: P = 4.67 × 10 −20 ; KS test; 5 min post-CSD: n = 8 cells, 8 mice and 30 min post-CSD: n = 9 cells, 9 mice). Magnified cumulative plot above shows larger amplitude events observed only in post-CSD group. Magnified cumulative plot to right shows expansion of histogram for lower amplitude range—rightward shift indicates larger EPSC amplitude for 5 and 30 min post-CSD groups.
