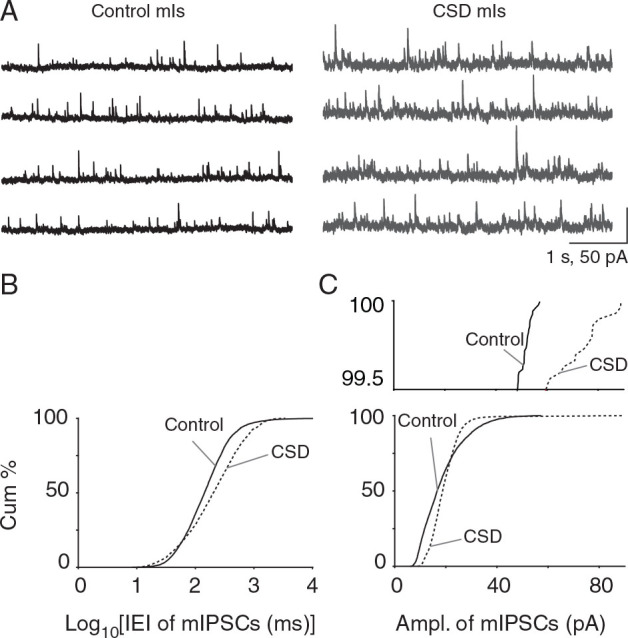
Figure 7.

Reduced frequency and increased amplitude of mIPSCs after CSD in vitro. ( A ) Recordings of mIPSCs from control and CSD groups. As with mEPSCs, TTX was delivered after CSD or sham. ( B ) There was a significant decrease in mIPSC frequency ( P = 2.34 × 10 −58 , KS-test; control: n = 5 cells, 5 mice and CSD: n = 6 cells, 6 mice). ( C ) A significant increase in mIPSC amplitude 30 min after CSD ( P = 1.80 × 10 −99 ; KS test). Magnified cumulative plot above shows larger than 40 pA IPSC events evident in post-CSD groups but not sham.
