Figure 2.

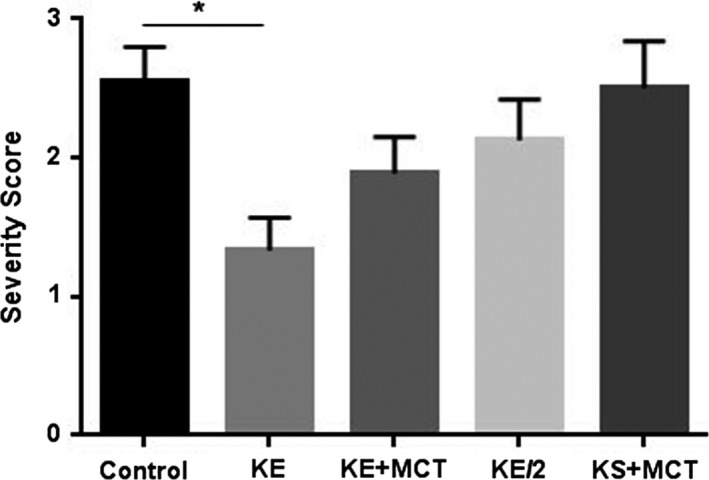
A bar graph displaying the severity of the seizure for all groups. The severity of seizures was significantly less in the KE group (P = 0.015), when compared to control.

A bar graph displaying the severity of the seizure for all groups. The severity of seizures was significantly less in the KE group (P = 0.015), when compared to control.