Figure 4.
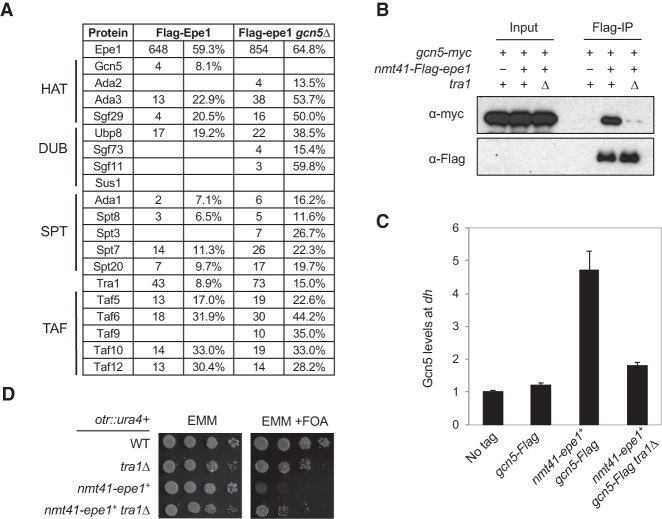
Epe1 associates with SAGA. (A) Mass spectrometry analyses of purified protein complexes. The spectral count (left) and the sequence coverage of each protein (right) are indicated. (B) Coimmunoprecipitation analyses of Epe1 and Gcn5. The lysates were treated with benzonase before immunoprecipitation was performed with Flag-agarose beads. Western blot analyses were performed with Flag and myc antibodies. (C) ChIP analyses of Gcn5 levels at pericentric dh repeat, shown as ChIP/input normalized to the no tag control. (D) Tenfold serial dilution analyses of the indicated yeast strains grown on the indicated media to measure the expression of the otr::ura4+ reporter gene.

