Figure 1.
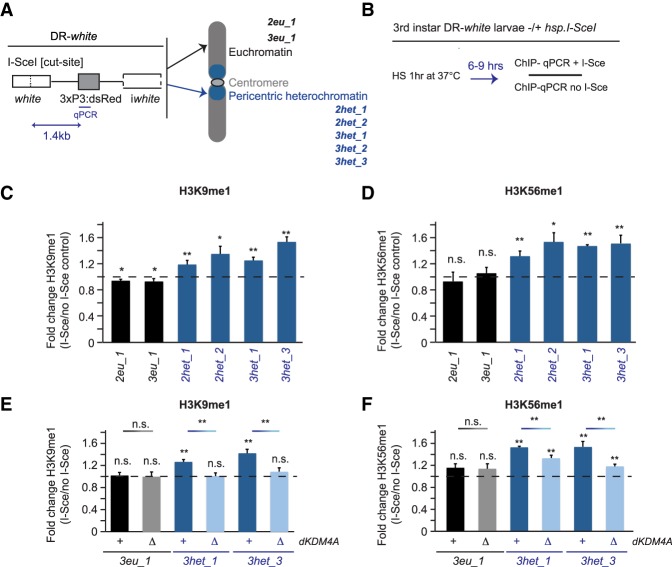
Increased H3K9me1 and H3K56me1 at heterochromatic DSBs is dependent on dKDM4A. (A) Schematic overview of the DR-white single-DSB system (Janssen et al. 2016) integrated in seven different fly lines in either euchromatic sites (EC; black; 1x chromosome 2 [2eu_1] or 1x chromosome 3 [3eu_1]) or heterochromatic sites (HC; blue; 2x chromosome 2 [2het_1 and 2het_2], and 3x chromosome 3 [3het_1, 3het_2, and 3het_3]). The I-SceI cut site in the DR-white construct is targeted for induction of a single DSB by the I-SceI endonuclease. (B) Schematic of ChIP (chromatin immunoprecipitation) experiments (results are shown in C–F). Third instar larvae with DR-white integrations in the presence or absence (control) of the hsp.I-SceI transgene were heat-shocked for 1 h at 37°C. Chromatin was prepared from larvae harvested 6–9 h after heat shock and subjected to ChIP and quantitative PCR (ChIP-qPCR) using a primer set 1.4 kb downstream from the I-SceI cut site. Relative enrichment over input was calculated for each ChIP sample. The relative increase after DSB induction (fold change) equals ChIP enrichment levels in hsp.I-SceI-expressing larvae (+DSB) divided by ChIP levels in larvae not expressing hsp.I-SceI (no DSB). (C–F) ChIP-qPCR analysis of the fold change in H3K9me1 (C,E) and H3K56me1 (D,F) levels observed upon single DSB induction at DR-white sites in euchromatin (black) and heterochromatin (blue) in wild-type (+) or homozygous dKDM4A deletion mutant (ΔdKDM4A) larvae. The dotted line indicates “no change” in the level of the respective marks between samples with and without a DSB. (n.s.) P-value ≥ 0.05; (*) P-value < 0.05; (**) P-value < 0.01, t-test, unpaired. Averages are shown for n ≥ 5 samples per condition +SEM.

