Figure 4.
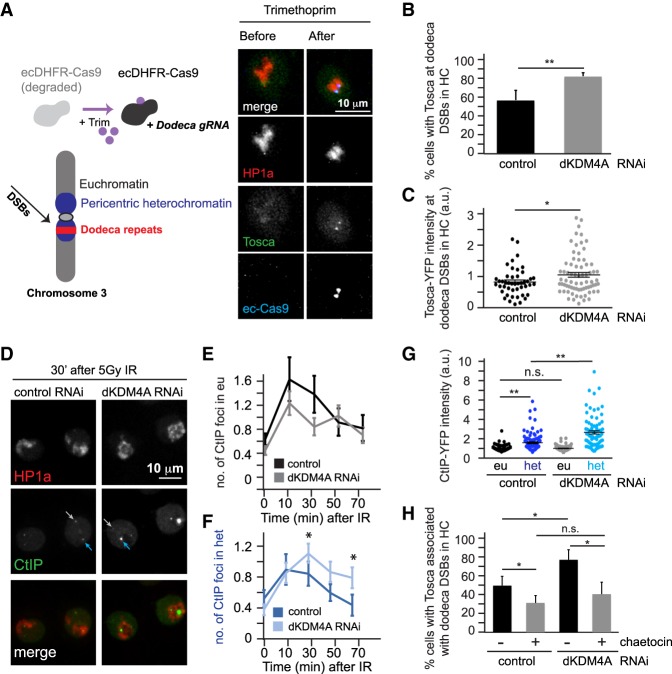
Increased HR protein localization at heterochromatic breaks in the absence of dKDM4A. (A, left) Trimethoprim addition stabilizes ecDHFR-Cas9. Concomitant expression of dodeca sgRNA with ecDHFR-Cas9 results in DSB induction at heterochromatic dodeca repeats in the pericentromeric heterochromatin of chromosome 3. (Right) Representative images of time-lapse movies of S2 cells stably expressing HP1a (red) and Tosca (HR protein; green) transiently transfected with fluorescently tagged inducible Cas9 (ecDHFR-Cas9; blue) and dodeca sgRNA. (B) Quantification of the number of cells with Tosca localization at dodeca repeats upon trimethoprim addition in yellow (control; black) or dKDM4A-depleted (gray) cells. Trimethoprim was added to the culture medium 10 min prior to imaging. Analysis was limited to cells that had visible Cas9 protein induction. (**) P-value < 0.01, unpaired t-test. Averages + SD are plotted for n = 3 experiments per condition. (C) Quantification of the level of Tosca protein present at Cas9-induced heterochromatic DSBs. Analysis was limited to cells that had visible HR protein localization to Cas9-induced DSBs, and nuclear background signal was subtracted. Each dot indicates one dodeca “focus” with Tosca (top) localization. (*) P-value < 0.05, unpaired t-test. n ≥ 46 cells per condition. The horizontal line indicates average + SEM. (D) Representative images of cells expressing CtIP-YFP (HR protein; green) and Cerulean-HP1a (heterochromatin protein; red) 30 min following 5 Gy of irradiation. Light-gray arrows point to CtIP foci in euchromatin, and blue arrows point to heterochromatic CtIP foci. (E,F) Quantification of images as in D of CtIP foci localization following 5 Gy of irradiation. The number of CtIP foci present within euchromatin (outside the HP1a domain; “eu”; light-gray arrows; E) or heterochromatin (within the HP1a domain; “het”; blue arrows; F) were quantified by live analysis of cells transfected with yellow RNAi (control; n = 35 cells) or dKDM4A RNAi (n = 61 cells). Averages are shown ±SEM. (*) P-value < 0.05, unpaired t-test. (G) Quantification of the level of CtIP-YFP protein present at ionizing radiation (IR)-induced heterochromatic (het) and euchromatic (eu) DSBs in cells transfected with yellow (control) or dKDM4A dsRNAs and imaged as in D. Analysis was performed 30 min after 5 Gy of IR, and nuclear CtIP background signal was subtracted. Each dot indicates one CtIP “focus.” (n.s.) P-value ≥ 0.05; (**) P-value < 0.001, unpaired t-test. n ≥ 74 cells per condition. The horizontal line indicates average + SEM. (H) Quantification of the number of cells with Tosca-YFP localization to dodeca repeats upon stabilization of Cas9 (through trimethoprim addition) in yellow (control) or dKDM4A-depleted cells in the presence (gray) or absence (black) of 0.5 µM Su(var)3-9 inhibitor chaetocin. Trimethoprim and chaetocin were added 10 min prior to the start of the movie. Analysis was limited to cells that had visible Cas9 induction. (n.s.) P-value ≥ 0.05; (*) P-value < 0.05, unpaired t-test. Averages + SD are plotted for n = 3 experiments per condition.

