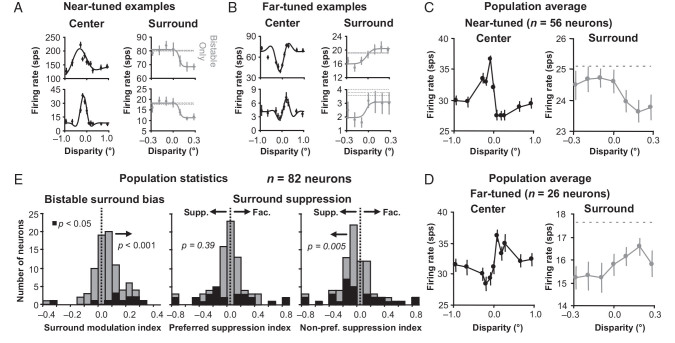
Figure 3.
Surround disambiguates the bistable disparity response. (A) Example near-tuned neurons. Left, classical receptive field (center) tuning curves. Right, responses to bistable disparity with unambiguous disparity in the surround (gray). (B) Same data for example far-tuned neurons. Error bars are standard error over trials. (C) Population averages of near-tuned neurons like the examples in (A). (D) Population averages of far-tuned neurons like the examples in (B). Error bars are standard error with respect to neurons. (E) Surround modulation and preferred and non-preferred suppression index histograms for a square annulus with a 2.0-degree inner border dimension. There was a significant positive surround modulation indicating a greater surround response to the preferred than non-preferred disparity. The significant negative suppression index for non-preferred disparity surrounds indicates that the surround was suppressive (supp.) rather than facilitative (fac.).

