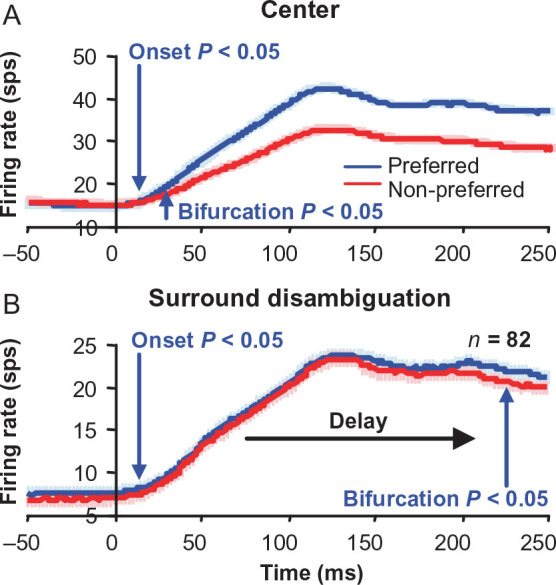
Figure 4.

Bifurcation point for surround disparity bistable disambiguation is substantially delayed. Population average for classical receptive field (center) (A) and surround (B) disparity tuning responses for near- and far-tuned neurons, showing the latency (arrows) of bifurcation between preferred (blue curves) and non-preferred (red curves) disparity responses. Bifurcation latency is much later in time for the surround than the center disparities. Error bars are standard error over neurons.
