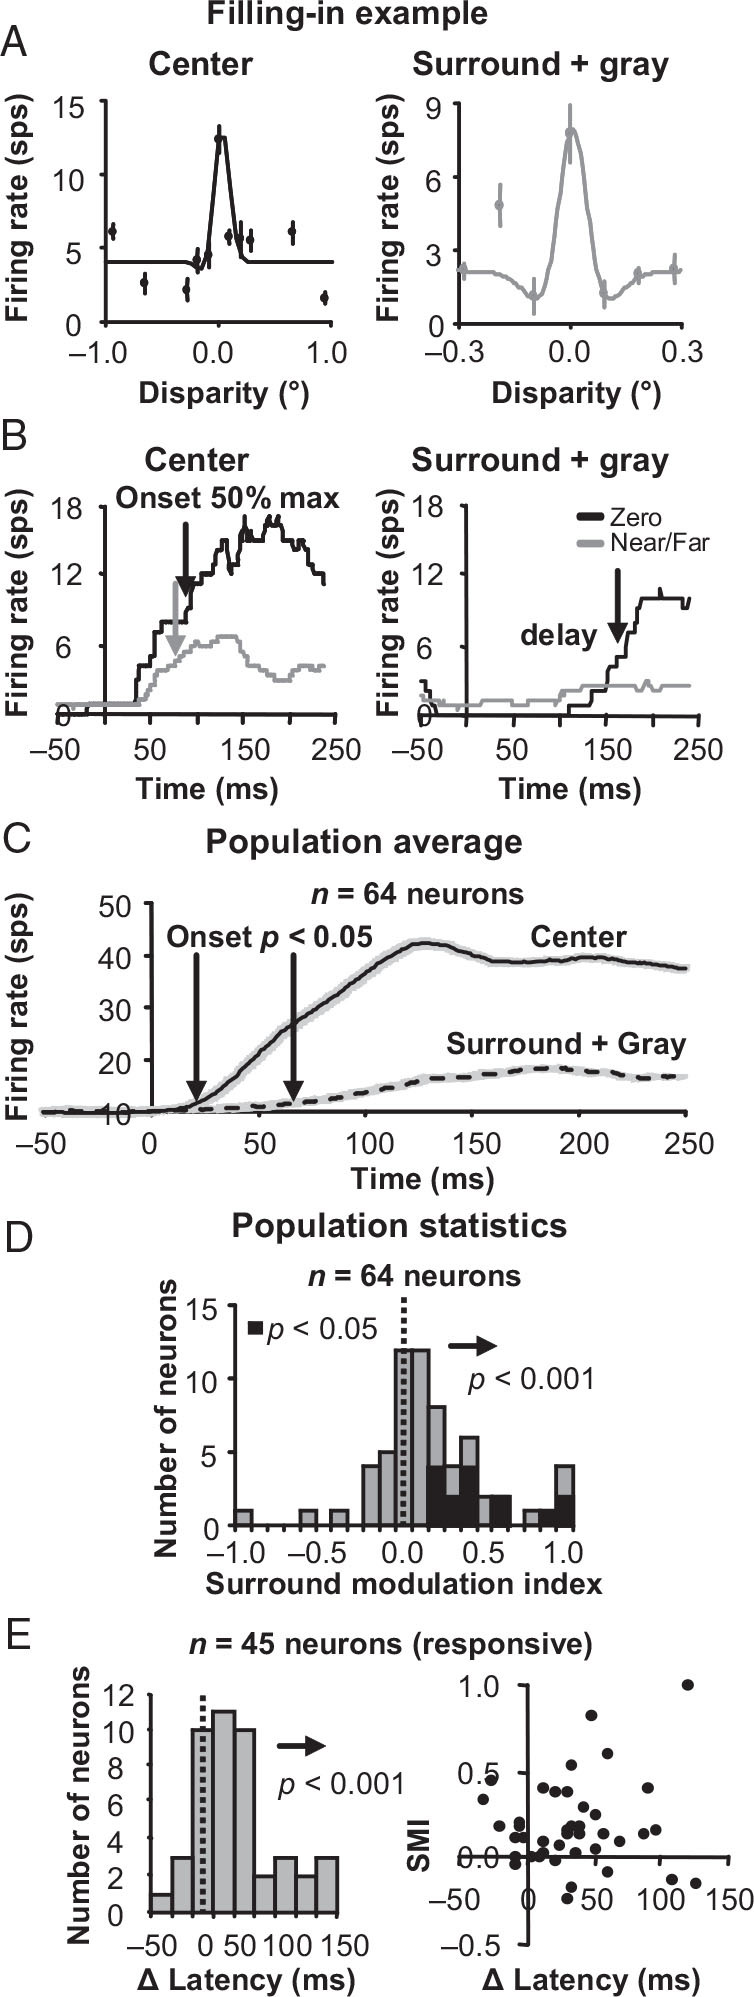
Figure 5.

Surround disparity tuning when a uniform gray surface is covering the classical receptive field. (A) An example zero-tuned neuron with surround disparity tuning that positively correlated with the center disparity tuning obtained by stimulation of the classical receptive field alone. Left, center tuning curves; right, the responses to a uniform gray surface with disparity in the surround. Error bars are standard error with respect to trials. (B) Responses for the same example neuron over time. On the left are the center responses to the preferred (zero; black line) and non-preferred (near/far; gray line) disparities from stimulation of the classical receptive field alone. On the right are the responses to uniform gray surface with the same preferred and non-preferred disparities presented in the surround. (C) Population average for preferred disparity center (solid line) and surround (dashed line) responses. Error bars are standard error over neurons. (D) Surround modulation index (SMI) histograms for the gray center plus disparity surround condition. (E) Difference in response onset latencies for DRDS in the surround versus within the classical receptive field for all neurons with a significant positive or negative surround response (left). Note that a significant surround response is different than significant SMI, which compares the difference between two different surround conditions. A scatter plot of SMI versus differences in onset latency (right) shows that the significant positive SMI is not the caused only by neurons with similar surround and center response onset latencies.
