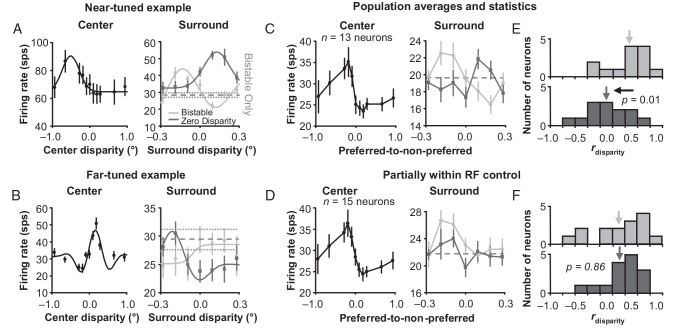
Figure 6.
Surround influence on unambiguous zero disparity input. (A) Example near-tuned neuron. Left, center disparity tuning curve. Right, the response to bistable (light gray, same experiment presented in Fig. 3) and zero (dark gray) disparity presented in the center with varying unambiguous disparity presented in the surround. (B) Same data for a far-tuned example neuron. Error bars are standard error with respect to trials. Population averages of near- and far-tuned neurons’ responses to the same conditions for a square annulus with a (C) 2.0-degree inner border dimension and (D) 1.5-degree inner border dimension. Error bars are standard error over neurons. Histograms of correlations between surround + bistable and center disparity tuning (light gray), as well as between surround + zero disparity and center disparity tuning (dark gray) for a square annulus with a (E) 2.0-degree inner border dimension and (F) 1.5-degree inner border dimension.

