
Figure 2: Mettl14 regulates self-renewal of cortical NSCs from E14.5 brain in neurosphere culture.
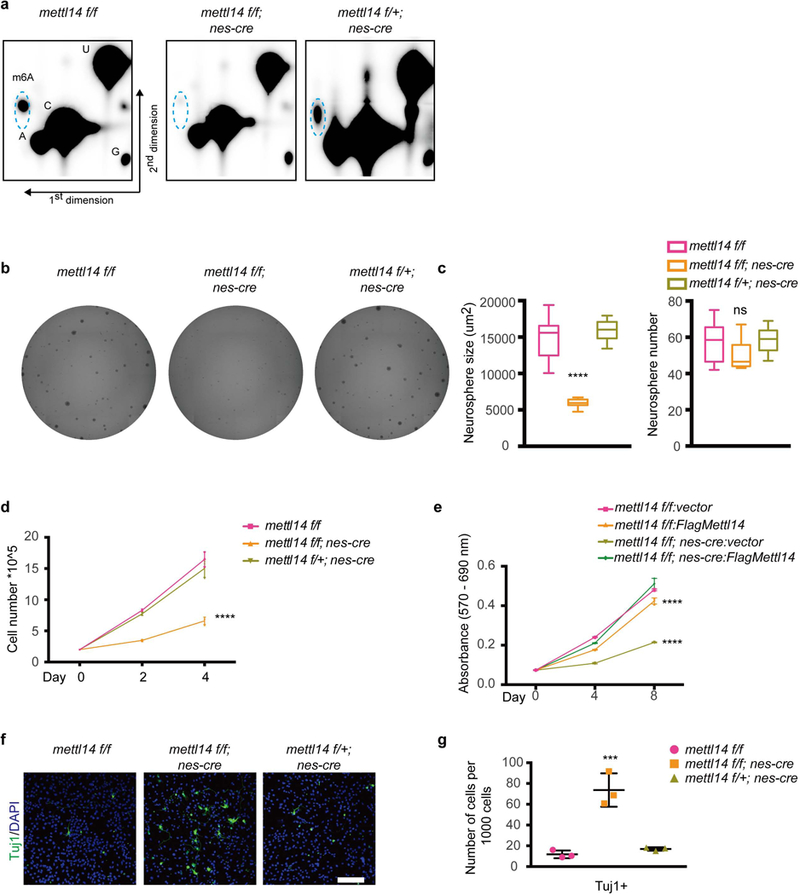
(a) Two dimensional thin-layer chromatography (2D-TLC) analysis of m6A levels in Ribosome- depleted (Ribo-) PolyA RNAs isolated from in E14.5 NSCs after 7 days of neurosphere culture. Dashed blue circles indicate m6A spots. Similar results were obtained from three independent experiments. (b) Representative images of neurospheres formed from isolated E14.5 NSCs. (c) Quantification of neurosphere number and area, one-way ANOVA (n = 12 cell cultures for all experimental groups; area, P = 9.15E-13, F (2, 33) = 80.21; number, P = 0.0313, F (2, 33) = 3.853) followed by Bonferroni’s post hoc test (area, WT vs. KO, P = 3.2475E-11, 95% C.I. = 6781 to 10737, WT vs. Het, P = 0.2855, 95% C.I. = −2999 to 663.1; number, WT vs. KO, P = 0.0724, 95% C.I. = −0.5596 to 15.39, WT vs. Het, P = 0.9999, 95% C.I. = −9.31 to 6.643). (d) NSC growth curve. NSCs were plated at 200,000/well in 6-well plates and counted 2 and 4 days later, two-way ANOVA (n = 3 cell cultures for all experimental groups; P = 8.644E-12, F (2, 18) = 143.6) followed by Bonferroni’s post hoc test (WT vs. KO, P = 1.2905E-11, 95% C.I. = 4.133 to 5.666, WT vs. Het, P = 0.091, 95% C.I. = −0.09277 to 1.44). (e) Growth curve of Mettl14 KO and nondeleted control NSCs transduced with indicated vectors. NSCs were plated in 96-well plates, and numbers determined by MTT assay, two-way ANOVA (n = 3 cell cultures for all experimental groups; P = 1.413E-20, F (3, 24) = 396.9) followed by Bonferroni’s post hoc test (WT-vector vs. WT-FlagMettl14, P = 1.162E-08, 95% C.I. = 0.02849 to 0.0514, WT-vector vs. KO-vector, P = 1.77094E-20, 95% C.I. = 0.1213 to 0.1442, WT-vector vs. KO-FlagMettl14, P = 0.9999, 95% C.I. = −0.01183 to 0.01107). (f) Immunostaining for anti-Tuj1 in NSCs cultured 7 days in vitro. Scale bar: 100 μM. (g) Quantification of immunostaining, one-way ANOVA (n = 3 fields for all experimental groups; P = 0.0004, F (2, 6) = 38.49) followed by Bonferroni’s post hoc test (WT vs. KO, P = 0.0004, 95% C.I. = −85.13 to −38.65, WT vs. Het, P = 0.9999, 95% C.I. = −28.37 to 18.11). Graphs represent the mean ± SD. Dots represent data from individual data points. The horizontal lines in the boxplots indicate medians; the box limits indicate first and third quantiles; and the vertical whisker lines indicate minimum and maximum values. ns = non-significant. *** P < 0.001, **** P < 0.0001.