
Figure 4: Mettl14 deficiency decreases number of late-born neurons.
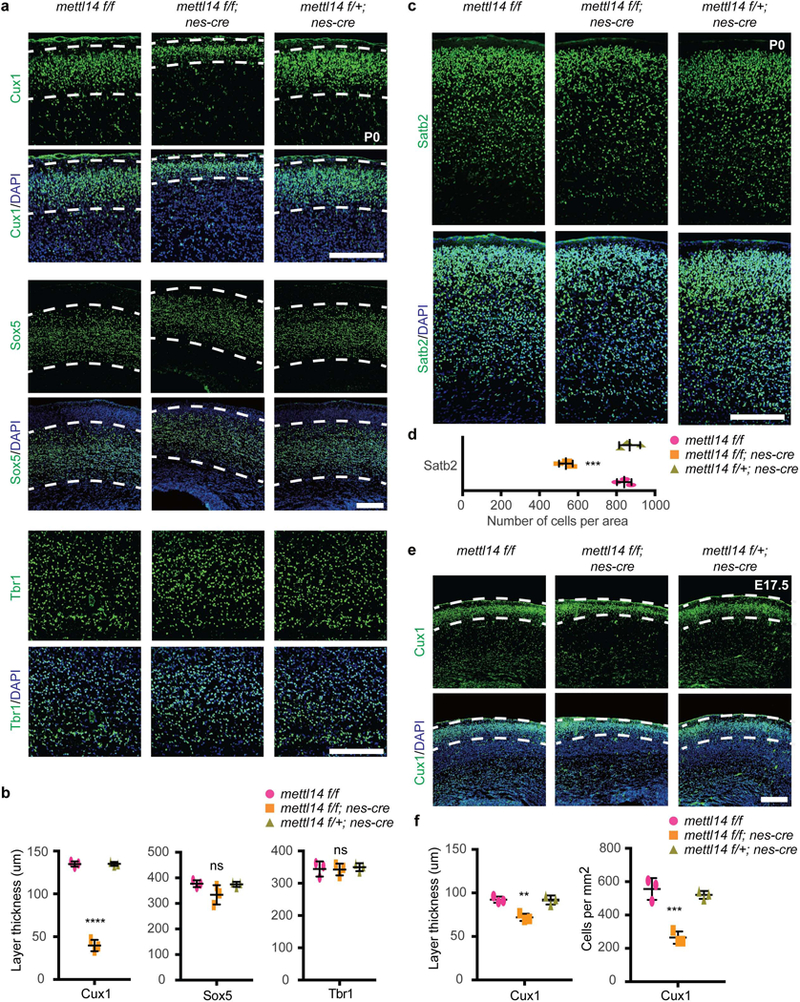
(a) Coronal sections of P0 brains stained with the layer II-IV marker Cux1, the layer V marker Sox5, and the layer VI/subplate (SP) marker Tbr1. Dashed white lines mark borders of Cux1+ and Sox5+ neuronal layers. (b) Quantification of thickness of Cux1+, Sox5+, or Tbr1+ neuronal layers, one-way ANOVA (n = 3 brain sections for all experimental groups; Cux1+, P = 2.689E-07, F (2, 6) = 461.8; Sox5+, P = 0.115, F (2, 6) = 3.169; Tbr1+, P = 0.8865, F (2, 6) = 0.1229) followed by Bonferroni’spost hoc test (Cux1+, WT vs. KO, P = 4E-07, 95% C.I. = 84.39 to 105.9, WT vs. Het, P = 0.9999, 95% C.I. = −10.97 to 10.52; Sox5+, WT vs. KO, P = 0.1329, 95% C.I. = −14.18 to 101.2, WT vs. Het, P = 0.9999, 95% C.I. = −55.32 to 60.06; Tbr1+, WT vs. KO, P = 0.9999, 95% C.I. = −43.31 to 46.59, WT vs. Het, P = 0.9999, 95% C.I. = −50.47 to 39.42). (c) Coronal sections of P0 brains stained with the layer II-IV marker Satb2. (d) Quantification of number of Satb2+ cells, one-way ANOVA (n = 3 brain sections for all experimental groups; P = 0.00015, F (2, 6) = 53.83) followed by Bonferroni’s post hoc test (WT vs. KO, P = 0.0003, 95% C.I. = 198.2 to 408.5, WT vs. Het, P = 0.9186, 95% C.I. = −133.1 to 77.14). (e) Coronal sections of E17.5 brains stained with Cux1; dashed white lines mark border of Cux1+ neuronal layer. (f) Quantification of Cux1+ layer thickness within dashed white lines and of the average number of newly generated Cux1+ cells within 1 mm2, as measured from the VZ to the lower dashed white lines, at E17.5. One-way ANOVA (n = 3 brain sections for all experimental groups; thickness, P = 0.0019, F (2, 6) = 21.36; number, P = 0.0004, F (2, 6) = 36.75) followed by Bonferroni’s post hoc test (thickness, WT vs. KO, P = 0.0025, 95% C.I. = 9.765 to 30.85, WT vs. Het, P = 0.9999, 95% C.I. = −10.13 to 10.96; number, WT vs. KO, P = 0.0004, 95% C.I. = 181.5 to 401.9, WT vs. Het, P = 0.7499, 95% C.I. = −74.64 to 145.8). Scale bars: 200 μM. Graphs represent the mean ± SD. Dots represent data from individual data points. ns = non-significant. ** P < 0.01, *** P < 0.001, **** P < 0.0001.