
Figure 5: m6A regulates NSC gene expression through histone modifications.
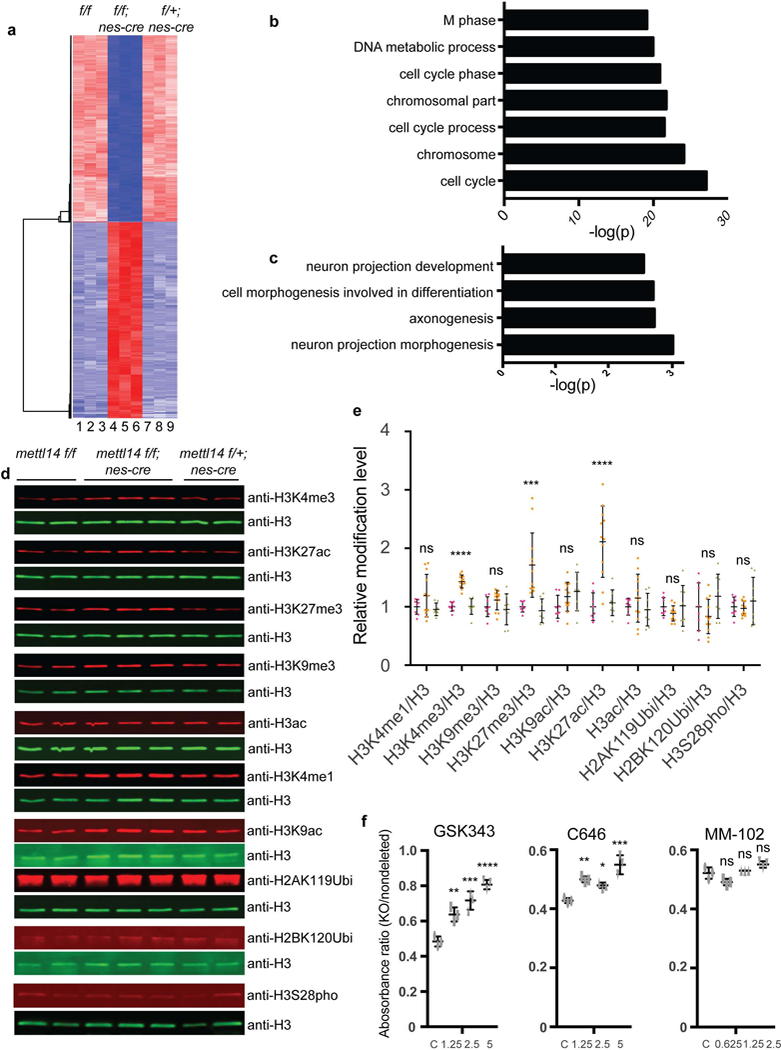
(a) Heat map analysis based on RNA-seq analysis in Mettl14 KO vs. nondeleted control NSCs. (b,c) Gene ontology (GO) analysis of genes down- and up-regulated in Mettl14 KO vs. nondeleted control E14.5 NSCs. GO analysis were performed by DAVID. Differentially expressed genes had an adjusted P < 0.01 and a 2-fold or greater expression difference. Among differentially expressed genes, 1099 are up-regulated and 1487 are down -regulated. Numbers of gene counts and exact P values for each GO term are listed in Supplementary Fig. 4a. (e) Representative western blots of acid-extracted histones from E14.5 NSCs using antibodies recognizing H3K4–1me, H3K4–3me, H3K27–3me, H3K9–3me, H3K27-ac, H3K9-ac, pan-acetyl- H3, uH2AK119, uH2BK120, and H3S28 phosphorylation. The band sizes range from 17 to 23 KD as expected for modified histones. For uncropped images, see Supplementary Fig. 6a. (f) Quantitation of western blots from E14.5 and E17.5 NSCs, one-way ANOVA (WT: n = 8, KO: n = 12, and Het: n = 8 independent NSCs cultures; H3K4me1, P = 0.1123, F (2, 25) = 2.39; H3K4me3, P = 1.06442E-09, F (2, 25) = 52.77; H3K9me3, P = 0.2096, F (2, 25) = 1.664; H3K27me3, P = 0.00013, F (2, 25) = 13.07; H3K9ac, P = 0.1461, F (2, 25) = 2.08; H3K27ac, P = 4.796E-06, F (2, 25) = 20.8; H3ac, P = 0.3676, F (2, 25) = 1.042; H2AK119Ubi, P = 0.3592, F (2, 25) = 1.067; H2BK120Ubi, P = 0.1192, F (2, 25) = 2.319; H3S28pho, P = 0.5347, F (2, 25) = 0.642) followed by Bonferroni’ spost hoc test (H3K4me1, WT vs. KO, P = 0.2376, 95% C.I. = - 0.4713 to 0.09065, WT vs. Het, P = 0.9999, 95% C.I. = −0.2629 to 0.3527; H3K4me3, WT vs. KO, P = 1.157E-08, 95% C.I. = −0.5518 to −0.3128, WT vs. Het, P = 0.9999, 95% C.I. = −0.134 to 0.1278; H3K9me3, WT vs. KO, P = 0.4574, 95% C.I. = −0.3314 to 0.1054, WT vs. Het, P = 0.9999, 95% C.I. = −0.1942 to 0.2842; H3K27me3, WT vs. KO, P = 0.0008, 95% C.I. = −1.131 to −0.2956, WT vs. Het, P = 0.9999, 95% C.I. = −0.3891 to 0.5256; H3K9ac, WT vs. KO, P = 0.321, 95% C.I. = −0.4577 to 0.1121, WT vs. Het, P = 0.1141, 95% C.I. = −0.5732 to 0.05098; H3K27ac, WT vs. KO, P = 1.769E-05, 95% C.I. = −1.591 to −0.6358, WT vs. Het, P = 0.9999, 95% C.I. = −0.5908 to 0.4556; H3ac, WT vs. KO, P = 0.6463, 95% C.I. = −0.4945 to 0.2007, WT vs. Het, P = 0.9999, 95% C.I. = −0.3309 to 0.4307; H2AK119Ubi, WT vs. KO, P = 0. 5288, 95% C.I. = −0.1242 to 0.3523, WT vs. Het, P = 0.9999, 95% C.I. = −0.2759 to 0.2459; H2BK120Ubi, WT vs. KO, P = 0.6171, 95% C.I. = −0.2165 to 0.5511, WT vs. Het, P = 0.6457, 95% C.I. = - 0.5982 to 0.2426; H3S28pho, WT vs. KO, P = 0.9999, 95% C.I. = −0.2407 to 0.2961, WT vs. Het, P = 0.8731, 95% C.I. = −0.3915 to 0.1965). (f) Cell growth analysis based on an MTT assay of NSCs treated with vehicle/DMSO or the MLL1 inhibitor MM-102, the CBP/P300 inhibitor C646, or the Ezh2 inhibitor GSK343. Shown is the absorbance ratio of KO to non-deleted controls at each drug dose. One-way ANOVA (n = 3 independent experiments for all experimental groups; GSK343, P = 4.232E-05, F (3, 8) = 38.47; C646, P = 0.0003, F (3, 8) = 23.43; MM-102, P = 0.0025, F (3, 8) = 11.91) followed by Bonferroni’s post hoc test (GSK343, c vs. 1.25, P = 0.0035, 95% C.I. = −0.2477 to −0.05943, c vs. 2.5, P = 0.0002, 95% C.I. = −0.3265 to −0.1383, c vs. 5, P = 1.979E-05, 95% C.I. = −0.4169 to - 0.2287; C646, c vs. 1.25, P = 0.0036, 95% C.I. = −0.1158 to −0.02744, c vs. 2.5, P = 0.0236, 95% C.I. = −0.09574 to −0.007344, c vs. 5, P = 0.000103, 95% C.I. = −0.1654 to −0.07702; MM-102, c vs. 0.0625, P = 0.0507, 95% C.I. = −8.591E-05 to 0.06086, c vs. 1.25, P = 0.9999, 95% C.I. = - 0.03858 to 0.02237, c vs. 2.5, P = 0.0615, 95% C.I. = −0.05958 to 0.001368). Graphs represent the mean ± SD. Dots represent data from individual data points. ns = nonsignificant. * P < 0.05, ** P < 0.01, *** P < 0.001, **** P < 0.0001.