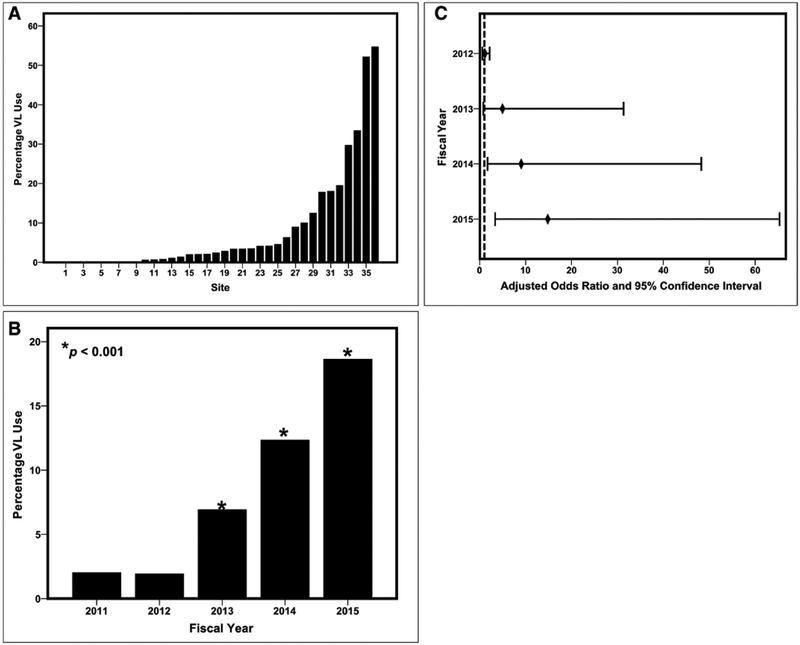
Figure 2.
Percentage of video laryngoscopy (VL) use for tracheal intubation (Tl) by participating PICU or cardiac ICU. A, There is a wide range in use of VL versus direct laryngoscopy (DL) for Tl across PICUs participating in the National Emergency Airway Registry for Children study. The distribution is a non parametric distribution with a right-skew. The median for VL use is 3% with a range of 0–55%. B, The use of VL increased from 1.97% in fiscal year (FY) 2011 to 12.3% (p < 0.001) and 18.6% (p < 0.001) in FY 2014 and FY 2015, respectively. C, Adjusted odds ratio of VL use over study time period compared with FY 2011. The vertical dashed line at 1.0 represents no difference in the use of VL versus DL by FY compared with FY 2011. The percentage of VL increased significantly from FY 2011 to FY 2014 and FY 2015.

