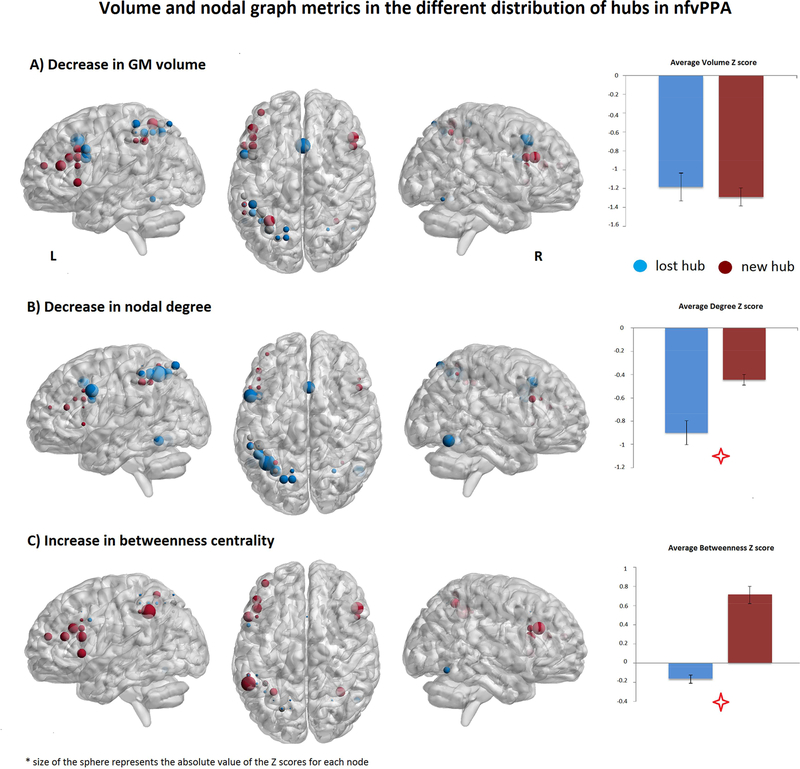
Figure 3:
The Z scores of the structural (GM volume) and nodal metrics (nodal degree and betweenness centrality) of the lost and new hubs in nfvPPA were calculated and displayed. The size of the sphere is proportional to: A) gray matter volume loss (bigger spheres = greater volume loss; B) decrease in nodal degree (bigger spheres = greater loss in number of connections); C) increase in betweenness (bigger spheres = higher value of betweenness centrality). As the figure suggests, the blue spheres (lost hubs in nfvPPA) have greater loss of degree while the red ones (new hubs in nfvPPA) have an increase of betweenness centrality. These differences were statistically significant between the group of lost and new hubs in patients. On the contrary there were not differences in volume between lost and gained hubs in nfvPPA.

