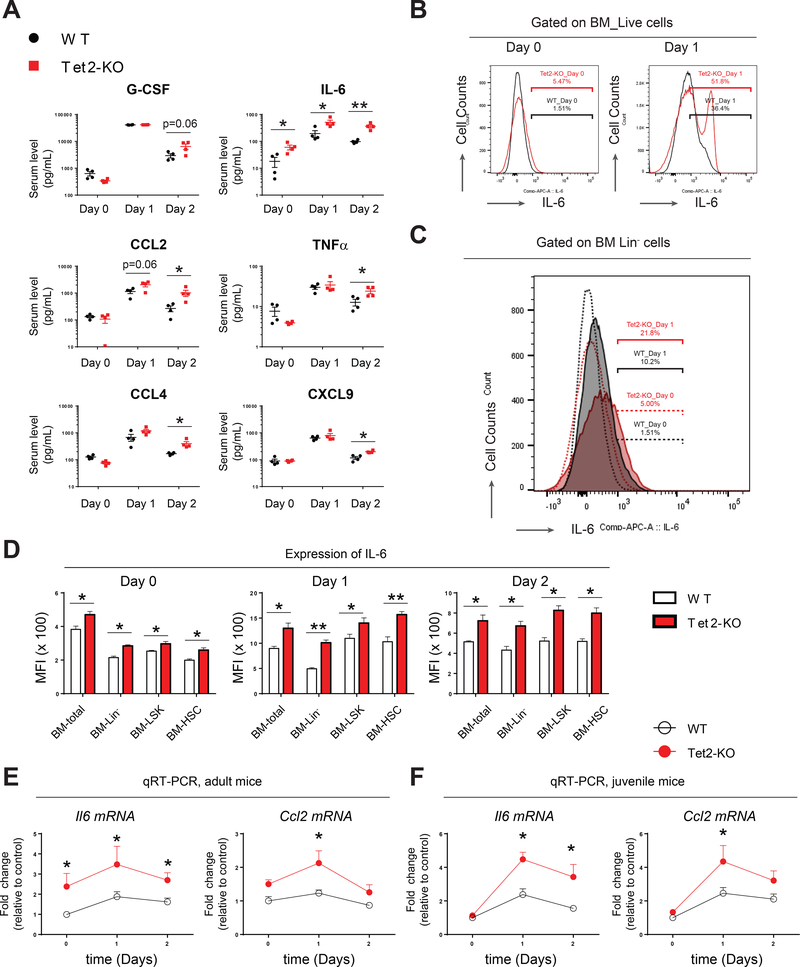
Figure 4. Tet2-KO mice show increased expression of IL-6 in serum and in various bone marrow subsets.
(A) Multiple cytokines/chemokines were increased on day 1 and/or day 2 post- LPS treatment in Tet2-KO mice, compared to wildtype controls.
(B-C) Intracellular flow cytometry analysis (ICFC) of IL-6 expression in total bone marrow cells and in Lin- bone marrow cells pre- and post-LPS treatment.
(D) Expression of IL-6 in indicated bone marrow subsets as assessed by flow cytometry and MFI quantification.
(E-F) QRT-PCR analysis of Il6 and Ccl2 expression in bone marrow Lin- cells derived from adult and juvenile pre- and post-LPS treated wildtype and Tet2-KO mice.
Data in (A) are from a single experiment (n=4 mice per group, mean ± s.e.m.). Data in (B) and (C) are from a representative experiment. Results are representative of two independent experiments. Data in (D), (E) and (F) are from a representative experiment (n= 4 mice per group, mean ± s.e.m.). Results are representative of two independent experiments. P value: * P < 0.05, ** P < 0.01, *** P < 0.001. n.s., not significant. Statistical analysis performed by unpaired, two-tailed Student’s t-test. See also Figure S4 for additional supporting data.

