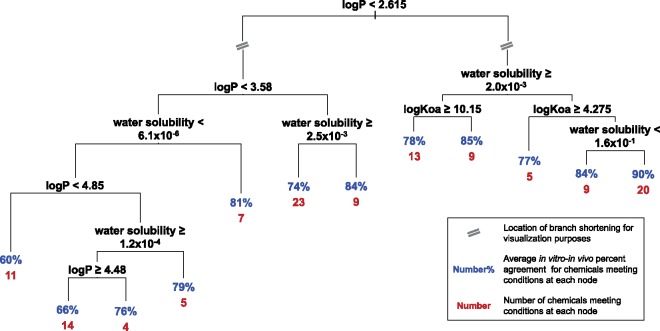
Figure 9.
Decision tree modeling of the most significant concordance predictors showing discrete ranges of predictor data associated with increased global concordance. At each node (split), the listed condition is true on the right branch, and false on the left branch. At each terminal node, the average percent agreement is shown in blue, and the number of chemicals at the node is shown in red. As an example, chemicals with logP <2.615 showed higher concordance, on average, in comparison with chemicals with logP >2.615. Note that one chemical did not have data for at least one of these physicochemical parameters and was thus excluded from this figure. Units are as follows: logP (unitless), logKoa (unitless), water solubility (mol/l). (For interpretation of the reference to color in this figure legend, the reader is referred to the web version of this article.)

