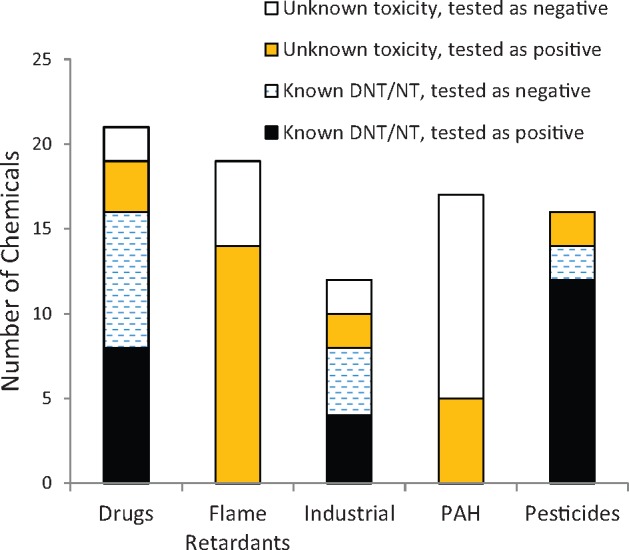
Figure 10.

Numbers of compounds from different categories tested positive or negative in the assay. The x-axis shows categories of compounds, and the y-axis shows the total number of compounds tested as positive/negative in the assay. The black bar indicates compounds that have previously been classified as developmental neurotoxicants (DNT) or neurotoxicants (NT) in the literature that were active (positive) in this assay; the dashed bar shows compounds that are classified as DNT/NT compounds in the literature that tested negative in this assay; the orange bar (the gray in back-white version) shows compounds with unknown toxicities that were positive and the white bar shows compounds with unknown toxicity in the literature which were tested as negative in the assay.
