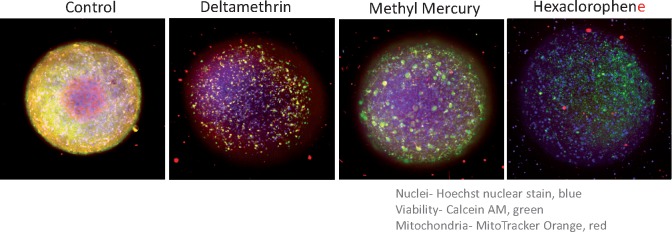
Figure 6.
Composite projection images of 3D neural cultures treated with 30 µM of indicated compounds for 24 h and then stained with a nuclear stain (Hoechst 33342), viability stain (Calcein AM), and mitochondria potential dye MitoTracker Orange CMTMRos for 2 h (2 µM, 1 µM, and 0.5 µM, respectively). Spheroids were imaged with the DAPI, FITC, and TRITC, 10× Plan Fluor objective, imaged using Z-stack of confocal images (30 images, 15 μm apart). Maximum projection images were analyzed using custom module editor for detection of spheroid size and shape, and also count of positive and negative cells in each tissue. The images show nuclei (blue), Calcein AM stain (green), and mitochondria (red).

