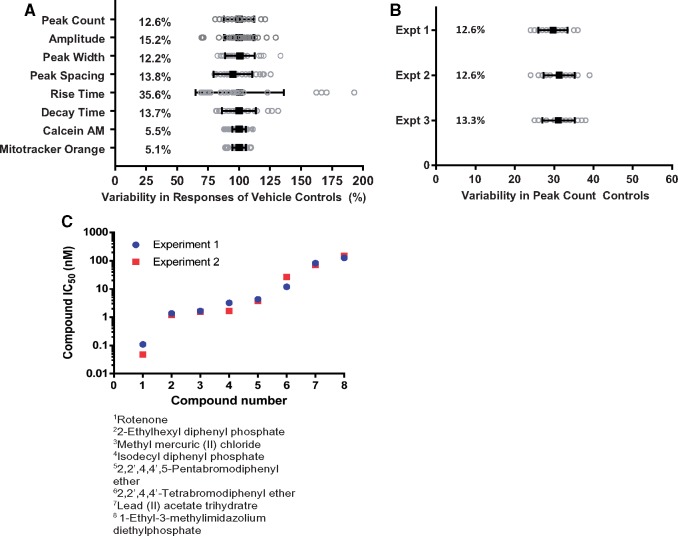
Figure 7.
Assay variability for calcium oscillation and viability readouts. (A) Intra-plate variability of different measurements for the vehicle control samples within a representative plate, (DMSO) n = 24 after 24 h of incubation, data not normalized. Mean (black squares) is shown for each phenotype overlaid on top of gray circles representing individual well responses. Coefficients of variation (%CV) are shown for each phenotype. (B) Variabilities in vehicle controls for peak counts (per 10 min recording) measured for 3 representative plates. Mean is shown (black squares) for each of three experiments overlaid on top of gray circles representing individual well responses. %CVs are also shown for each experiment. (C) Comparison of compound responses (EC50 values) between 2 plates for 8 test compounds (24 h treatment). Pearson correlation between experiments was r = 0.987 p < .0001, Spearman correlation r = 1.000, p < .0001.

