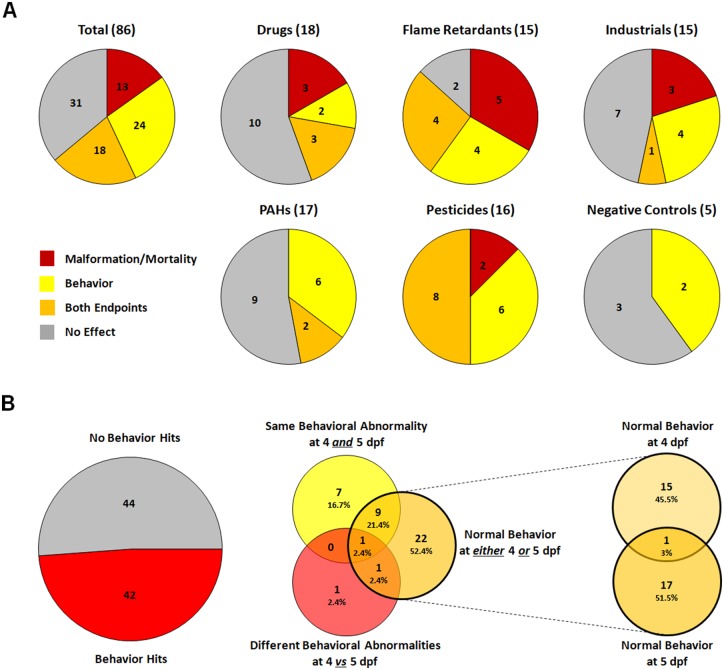
Figure 6.
Summary of hits. A, Pie graphs illustrating the total number of compounds within each chemical set that caused only mortality/teratology (red), only behavioral abnormalities (yellow), were hits for both mortality/teratology and behavior (orange) or were negative for both endpoints (gray). The number in parentheses next to the name of each chemical set indicates the total number of compounds in the set. B, Venn diagrams illustrating the total number of compounds that caused behavioral abnormalities at either time point, with further breakdown as to the number that caused the same behavioral abnormality at both 4 and 5 dpf (yellow) versus the number that caused different behavioral abnormalities at 4 versus 5 dpf (red) versus the number that did not alter normal behavior at either 4 or 5 dpf (orange). Any individual compound could belong to more than one behavioral category if different concentrations caused different outcomes.

