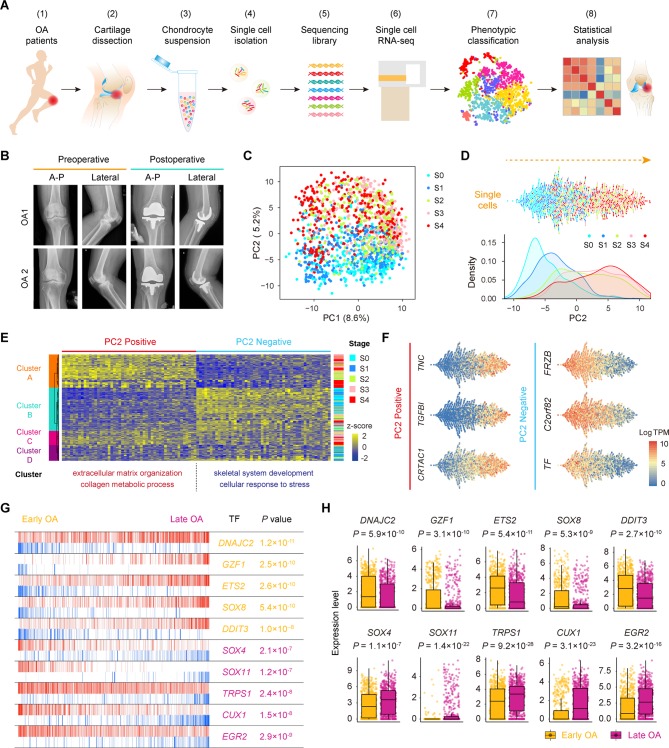
Figure 1.
Single-cell RNA-seq of human OA cartilage chondrocytes. (A) Schematic workflow of the experimental strategy. (B) Representative preoperative and postoperative radiographs of patients with knee OA undergoing arthroplasty. (C) PCA plot of single-cell transcriptomes based on the 500 most variable genes. S0 to S4, stage 0 to 4. (D) Beeswarm plot showing all filtered cells according to their coordinates along PC2 and coloured according to the OA stage of the cartilage sample. The cell density distribution of each stage along PC2 is shown below. (E) Hierarchical clustering of cells (rows) using the 50 most positively correlated and 50 most negatively correlated genes (columns) along PC2. Cells are classified into four clusters (left sidebar). The enriched GO terms for the genes showing the greatest correlation along PC2 are shown below. (F) The expression levels of three representative genes showing positive and negative correlations along PC2. (G) The top 10 candidate transcription factors for early-stage (S0 and S1, yellow) and late-stage (S3 and S4, purple) OA identified by the master regulator analysis algorithm (MARINa). Genes are rank-sorted according to their expression levels on the x-axis for regulators, with the p value depicting the enrichment significance. (H) Boxplots showing the expression levels of early-stage and late-stage OA candidate transcription factors and p values representing the significance of expression levels. GO, gene ontology; PCA, principal component analysis; OA, osteoarthritis.

