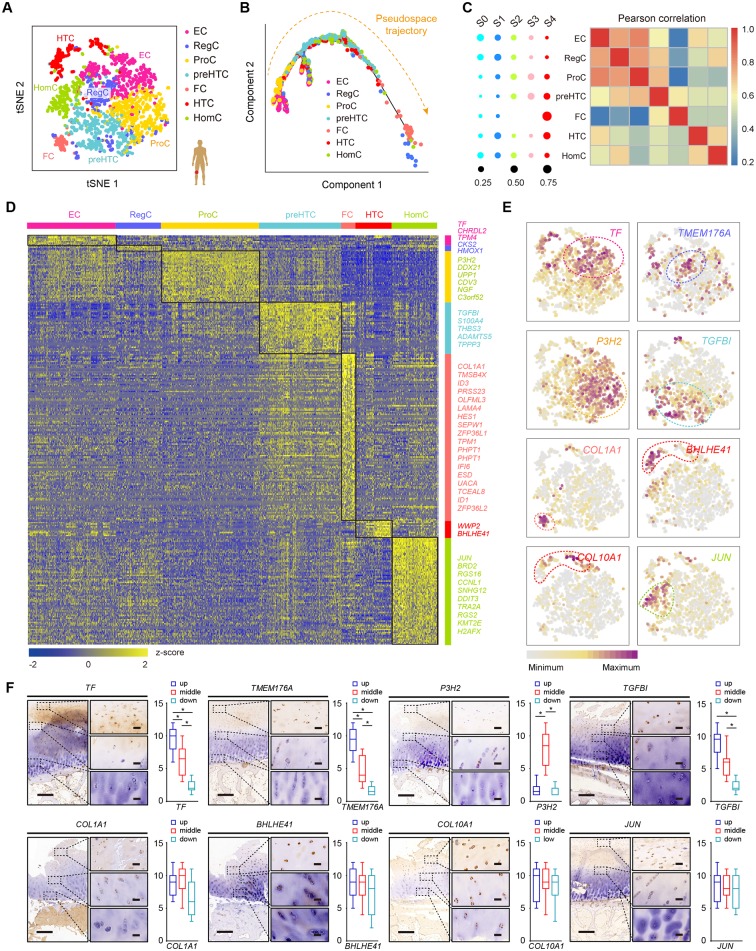
Figure 2.
Identification of chondrocyte populations and gene signatures during human OA progression. (A) Visualisation of t-SNE coloured according to cell types for human OA cartilage single-cell transcriptomes. (B) Monocle pseudospace trajectory revealing the OA chondrocyte lineage progression coloured according to cell types. (C) Dot plots showing the stage distribution in each cluster. Heatmap showing the pairwise correlations. (D) Heatmap revealing the scaled expression of differentially expressed genes for each cluster defined in (A). Specific representative genes in each chondrocyte subsets are highlighted along the right margin. The colour scheme is based on z-scores. (E) Dot plots showing the expression of indicated markers for each cell cluster on the t-SNE map. (F) Representative immunohistochemistry assay of indicated genes in cartilage tissues. Scale bar, left, 500 µm; right, 50 µm. The scores of different areas (up, middle, down) in cartilage tissues based on the immunohistochemistry assay are shown. *p<0.05, otherwise, not significant. EC, effector chondrocyte; RegC, regulatory chondrocyte; ProC, proliferative chondrocyte; preHTC, prehypertrophic chondrocyte; FC, fibrocartilage chondrocyte; HTC, hypertrophic chondrocyte; HomC, homeostatic chondrocyte; OA, osteoarthritis; t-SNE, t-distributed stochastic neighbour embedding.

