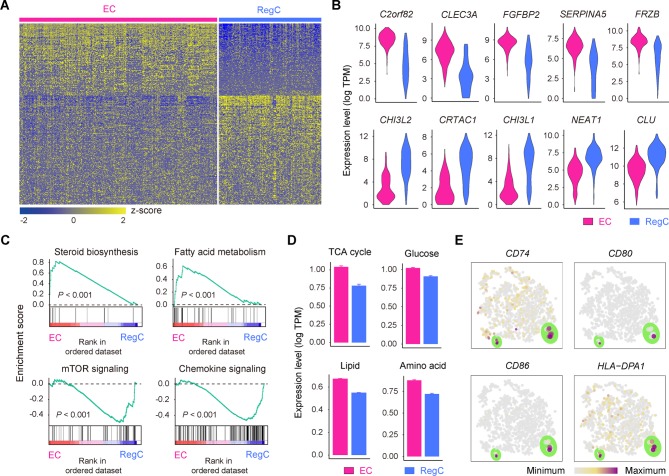
Figure 3.
Definition of ECs and RegCs. (A) Heatmap showing scaled expression of differentially expressed genes defining the EC and RegC subsets. (B) Violin plots showing the expression levels of representative candidate marker genes for ECs and RegCs. (C) GSEA showing enrichment of pathways between ECs and RegCs. (D) The expression levels of genes associated with the TCA (p=1.4×10⁻²⁵) and with glucose (p=1.5×10⁻¹⁵), lipid (p=2.7×10–182) and amino acid (p=3.2×10–58) metabolism in ECs and RegCs. (E) The cells are coloured according to the expression levels of the indicated markers for antigen processing and presentation on the t-SNE map. Cells are shown enlarged in the section outlined in green. ECs, effector chondrocytes; RegCs, regulatory chondrocytes; GSEA, gene set enrichment analysis; TCA, tricarboxylic acid cycle; t-SNE, t-distributed stochastic neighbour embedding.

