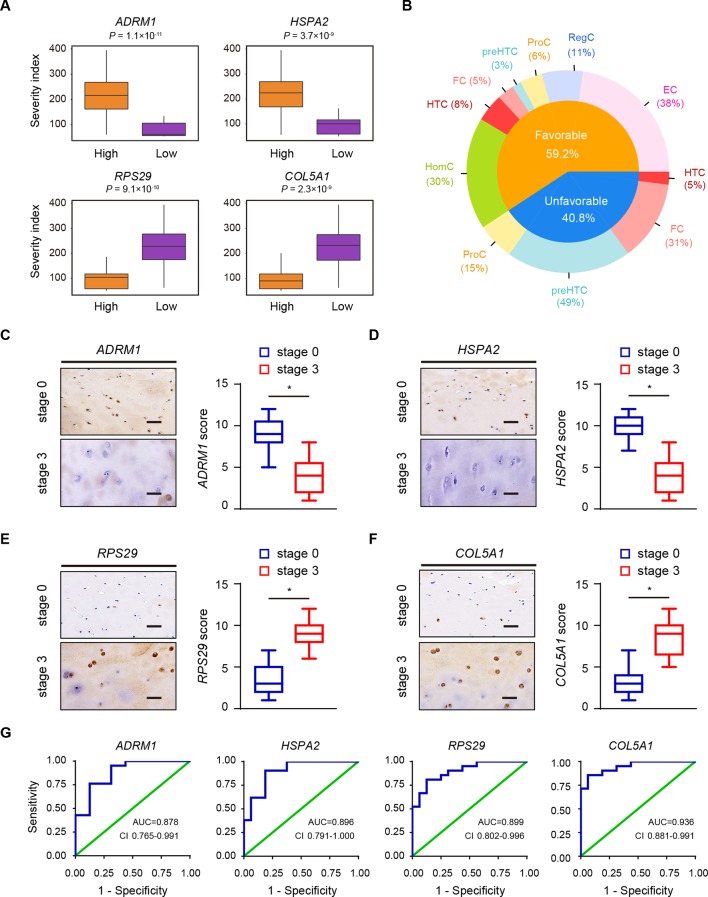
Figure 6.
Clinical outcome in relation to the structure of the OA landscape. (A) Examples of the relationship between the severity index and predictive genes. Orange and purple boxplots corresponding to two groups of samples with high and low levels of gene expression, respectively. (B) Favourable and unfavourable predictive gene distributions in different OA chondrocyte types. (C–F) Representative immunohistochemistry assay of ADRM1 (C), HSPA2 (D), RPS29 (E) and COL5A1 (F) in cartilage tissues of OA stage 0 and stage 3. Scale bar, 50 µm. The scores of the indicated genes in cartilage tissues based on the immunohistochemistry assay are shown. *p<0.05. (G) ROC curve for the individual ADRM1 (RT<0.6569, sensitivity 0.762, specificity 0.875), HSPA2 (RT<0.7473, sensitivity 0.901, specificity 0.813), RPS29 (RT>1.186, sensitivity 0.810, specificity 0.875) and COL5A1 (RT>1.352, sensitivity 0.857, specificity 0.938) to separate patients with OA from health controls. AUC, area under curve; ECs, effector chondrocytes; RegCs, regulatory chondrocytes; ProCs, proliferative chondrocytes; preHTCs, prehypertrophic chondrocytes; FCs, fibrocartilage chondrocytes; HTCs, hypertrophic chondrocytes; HomCs, homeostatic chondrocytes; OA, osteoarthritis; ROC, receiver-operating characteristic; RT, ratio threshold.

