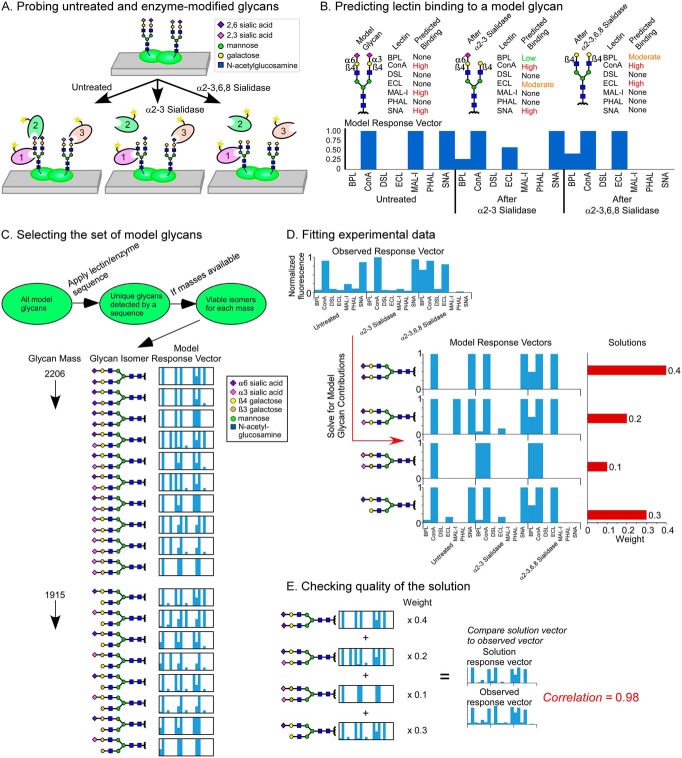
Fig. 1.
Solving for glycan structures using patterns of lectin binding. (A) Microspots of proteins are probed by a panel of lectins, applied with or without modification of the glycans using exoglycosidases. (B) Lectin binding to model glycans is simulated for each round of profiling. The predicted binding levels are assembled into a response vector. (C) Sets of model glycans are defined that represent potential solutions to the glycans in a sample. The set can be filtered to include only those that are tested by the lectins and enzymes used in the experiment or to include only those that have masses known to be present. A model response vector is produced for every model glycan in the final set. (D) We use linear algebra to solve for the combinations of model response vectors that give a least-squares fit of data. Any number of glycans from the input list may be included in a fit; in this example data, the least squares fit uses four model response vectors from the larger set in 1C. (E) We multiply each model response vector in the solution by its weight and then sum the results to produce a solution response vector. The solution response vector is compared with the observed response vector to assess the closeness of the fit.

