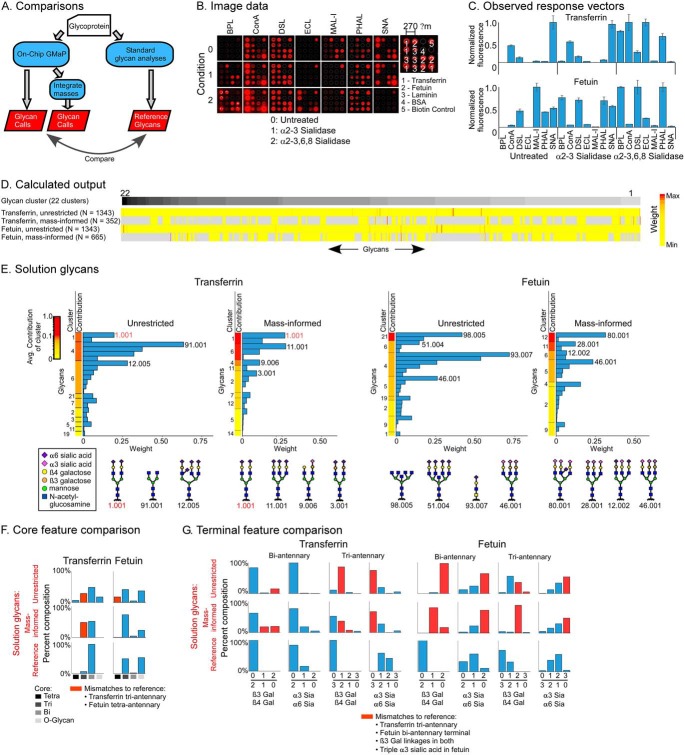
Fig. 3.
Solving for glycans on transferrin and fetuin. (A) We made glycan determinations using on-chip gmap alone or with integration of information on the masses present in each sample. The glycan calls were compared with the reference glycans. (B) Raw image data. (C) Observed response vectors. (D) The unrestricted list included 1,343 glycans grouped into 22 clusters based on similarity of response vectors. The color scale indicates the calculated weight of each glycan. The mass-informed input lists were subsets of the unrestricted lists, with gray indicating not-included glycans. (E) The glycans in the solution of each analysis were grouped by cluster and ordered by the average contribution to the response vector of the glycans in the cluster. Structures are given for the top glycan from each cluster that contributes at least 0.05 (5%) of the total. The red text indicates glycans present in the reference. (F, G) The fraction of glycans containing a particular core (panel F) or terminal feature (panel G) was determined in the reference glycans and in the two sets of solution glycans. (The α6 sialic-acid count includes a small number of glycans that lack one sialic acid.) The red columns indicate discrepancies between the reference and the solutions.

