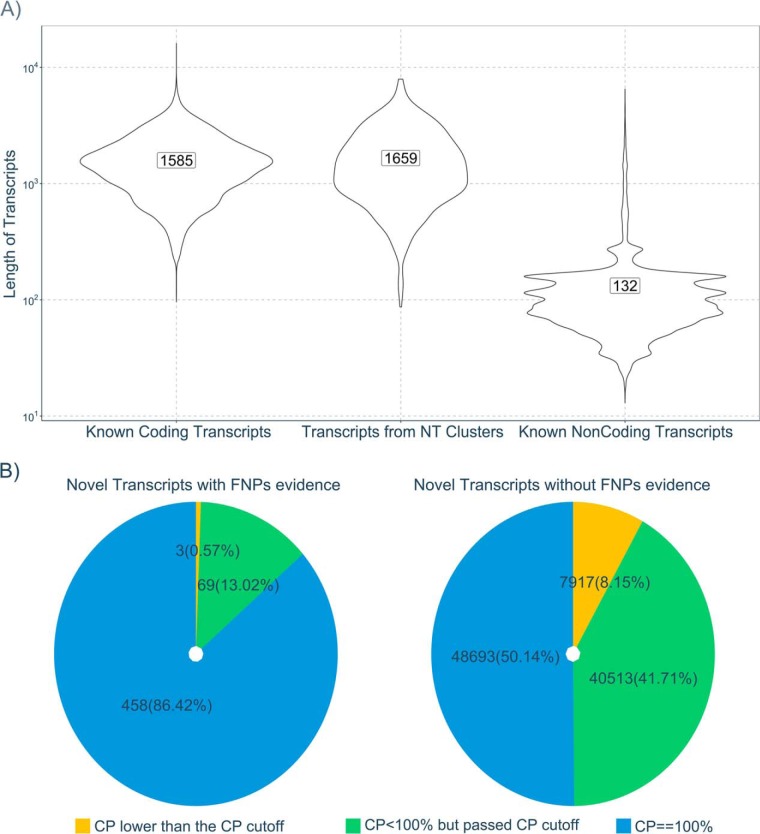
Fig. 5.
Evaluation to the NEs with the evidence of FNPs. A, The length distribution of novel transcripts from NEs with evidence of FNPs (left) compared with coding (middle) and noncoding transcripts (right) from IRGSP-1.0.30. B, The coding potential (CP) of novel transcripts from NEs with evidence of FNPs and without evidence of FNPs.

