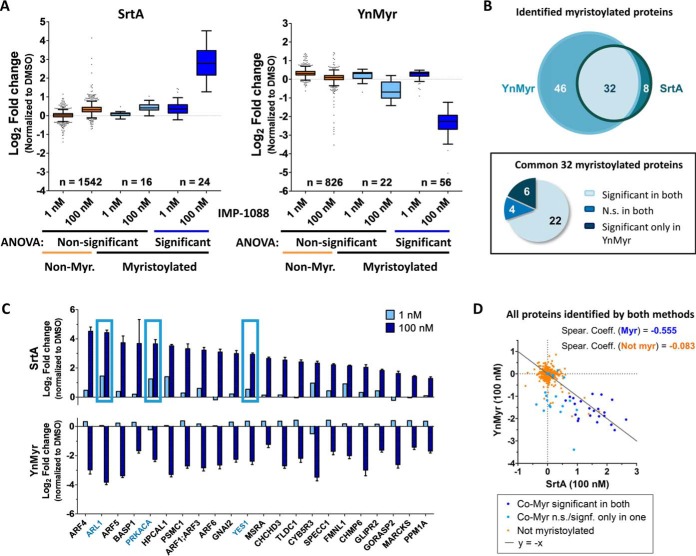
Fig. 4.
SrtA-labeling complements YnMyr metabolic tagging for quantitative profiling of NMT activity by protein-enrichment proteomics analysis. MDA-MB-231 cells were incubated in the presence of control (DMSO), low (1 nm) or high (100 nm) concentrations of NMT inhibitor IMP-1088 for 24 h and either biotinylated with SrtA post-lysis or fed with YnMyr for the duration of the NMT inhibitor treatment and biotinylated via CuAAC. Biotin-labeled proteins were enriched on NeutrAvidin beads and analyzed by nanoLC-MS/MS. A, Boxplot representation of fold changes for known myristoylated proteins versus all other identified proteins for both methods, derived from a one-way ANOVA test performed on all identified proteins (FDR = 0.01 and S0 = 1). B, Pie chart and Venn diagram comparing number of identified known myristoylated proteins and their response to NMT inhibition by each method. N.S., nonsignificant (ANOVA, FDR = 0.01 and S0 = 1). C, Bar plots showing side-by-side comparison of myristoylated proteins identified and significantly changing in both methods. Boxes highlight proteins selected for follow-up studies. D, Correlation of SrtA and YnMyr labeling enrichments in 100 nm IMP-1088 treated samples.

