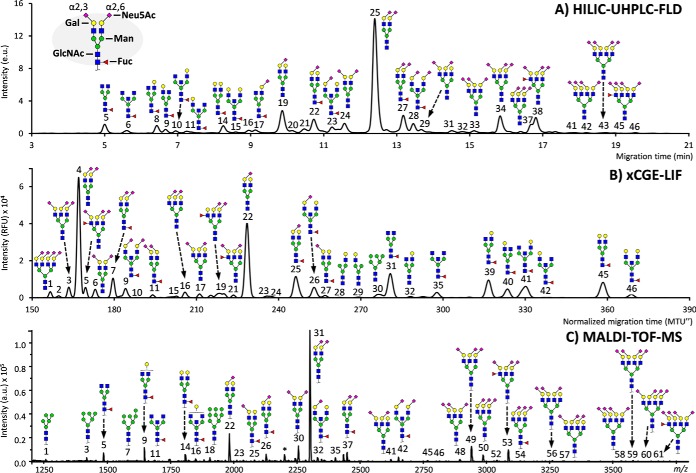
Fig. 1.
The respective profiles of the same total plasma protein N-glycan standard as recorded by HILIC-UHPLC-FLD, xCGE-LIF and MALDI-TOF-MS. (A) Chromatogram as obtained by HILIC-UHPLC-FLD after 2-aminobenzamide labeling. (B) Electropherogram as obtained by xCGE-LIF after APTS labeling. (C) Mass spectrum as obtained by MALDI-TOF-MS after ethyl esterification, with species assigned as [M+Na]+. Signals of all recordings have been annotated to the best of knowledge, making use of the detections across the methods as well as established literature on biochemical pathways and plasma/serum N-glycosylation. The display of linkage has been restricted to the N-acetylneuraminic acids (sialic acids), which was principally acquired by MALDI-TOF-MS. Branching differences (galactose arm, bisection, fucose position) were only distinguishable by HILIC-UHPLC-FLD and xCGE-LIF. For full assignments of the signals, see supplemental Tables S1–S3, as well as supplemental Fig. S1.

