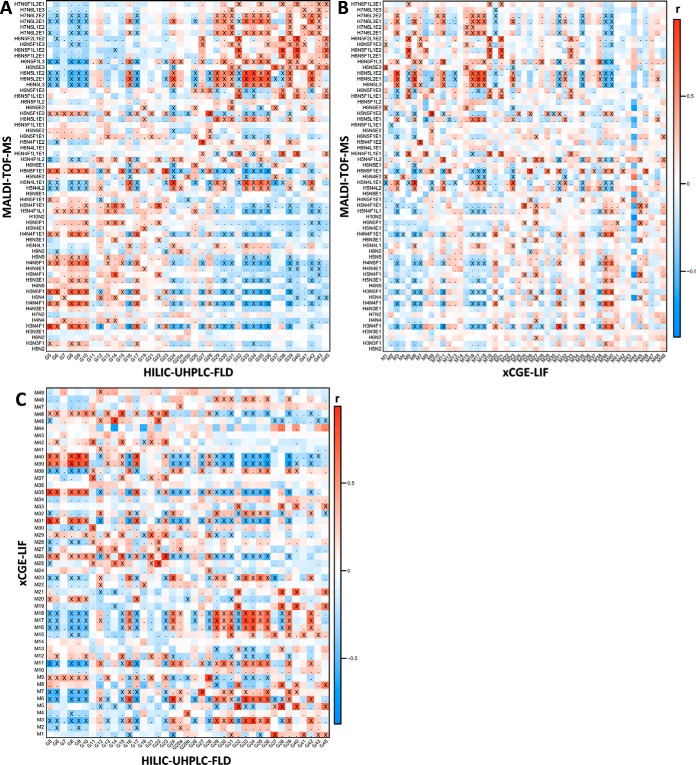
Fig. 2.
Heat map visualizing the Pearson correlation between signals from MALDI-TOF-MS, HILIC-UHPLC-FLD (participant 2) and xCGE-LIF. (A) HILIC-UHPLC-FLD (horizontal) with MALDI-TOF-MS (vertical). (B) xCGE-LIF (horizontal) with MALDI-TOF-MS (vertical). (C) HILIC-UHPLC-FLD (horizontal) with xCGE-LIF (vertical). Signal correlations were calculated on clinical data, and represent similarity of behavior with biological phenotypes such as pregnancy and RA as well as technical variation. Crosses (X) indicate correlations significant below a p value of 1·10−5, whereas dots (.) indicate correlation below a p value of 0.05. For similar heat maps between non-MS methods and derived traits see supplemental Figs. S4–S6. H = hexose, N = N-acetylhexosamine, F = deoxyhexose (fucose), L = (lactonized) α2,3-linked N-acetylneuraminic acid, and E = (ethyl esterified) α2,6-linked N-acetylneuraminic acid.

