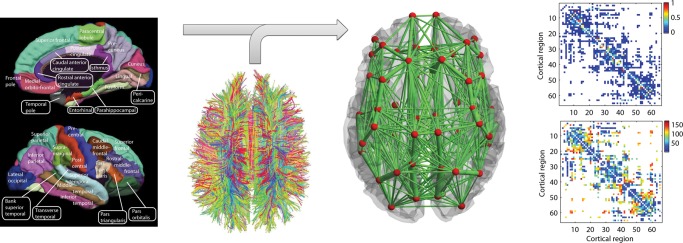
Figure 1.
Anatomical connectome derived by Hagmann et al. (2007) using DSI averaged over 5 healthy subjects. (Left) The parcellation scheme dividing the cortex into 33 anatomically segregated regions in each hemisphere [adapted from Hagmann et al. (2008)]. (Middle-left) White matter tracts detected using DSI and tractography [adapted from Honey et al. (2007)]. (Middle-right) Schematic representation of the anatomical network, where regions are represented by red spheres placed at their center of gravity and the link's thickness is proportional to the number of fiber tracts detected in each connection. (Right-top) The coupling weights are proportional to the number of tracts detected. White color means that no fiber connecting the 2 corresponding regions was detected. Weights were normalized so that they are between 0 and 1. (Right-bottom) Distance between regions (in mm) given as the average length of the fibers connecting a pair of regions. The list of brain regions is reported in Table 2.

