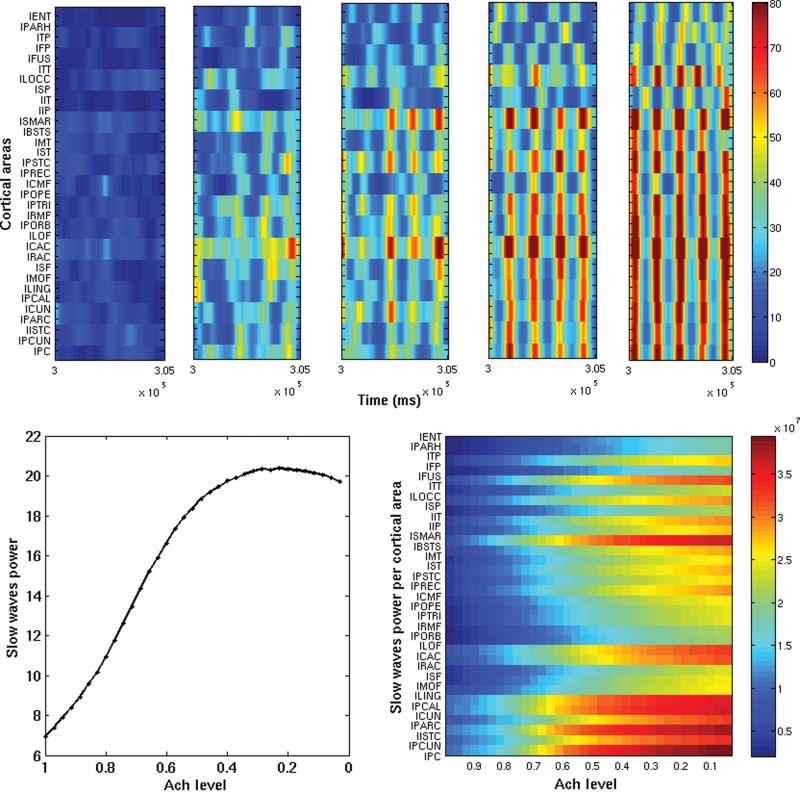
Figure 2.
Top subpanels: Envelopes of the slow sleep oscillations of each cortical area (based on the firing rates) as a function of time, for 5 snapshot of 10 s (after the first 10 min). Only half hemisphere is shown. The 5 snapshots correspond to different Ach levels, namely: ζ = 1, 0.71, 0.57, 0.42, 0, and 1, from left to right, respectively. Increasing the level of Ach (i.e. getting awake) reduces the presence of slow sleep waves, so that only local (in space and time) slow sleep waves emerge according to the experimental observations of Vyazovskiy et al. (2011). Bottom panel (left): Total power (summed over all cortical areas) of slow sleep waves as a function of the Ach level. Bottom panel (right): Power of slow sleep waves for each cortical area as a function of the Ach level. Awakening decreases the power of the slow sleep waves.

