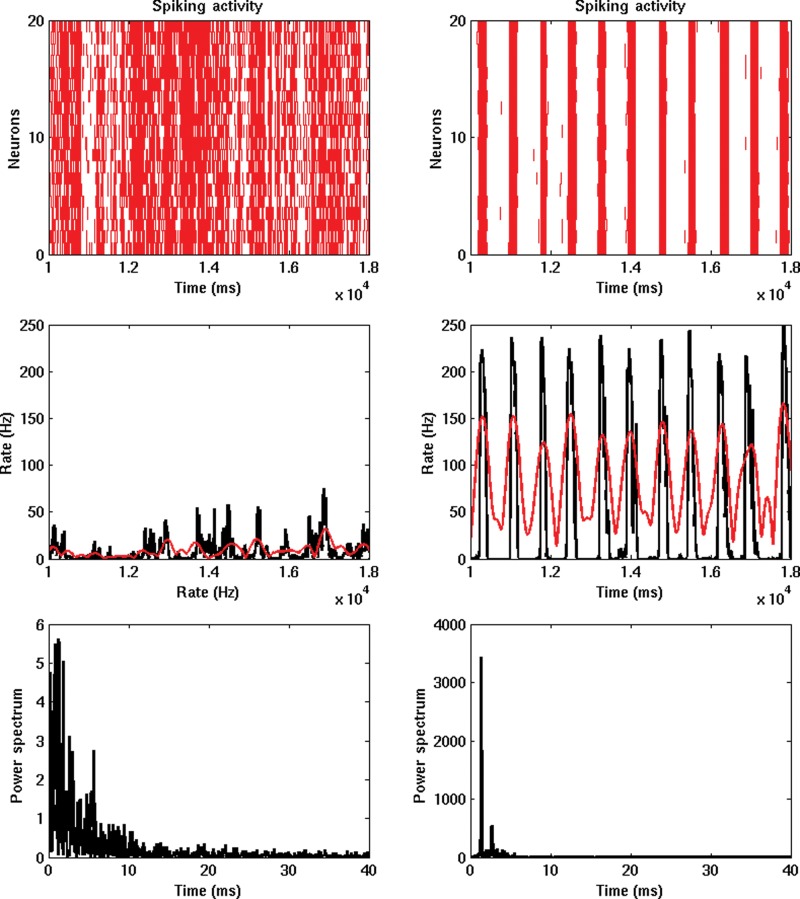
Figure 3.
Firing rate activity of one particular area (lPC). Left (right) subpanels correspond to high (low) Ach levels (i.e. to awake, deep sleep phases, respectively). Top panels show the spiking activity of 20 randomly chosen neurons of the lPC excitatory population. The middle panels show the corresponding firing rate activity (in black) calculated using all neurons on the excitatory population of the lPC (and no filtering at all). These panels also show the results of the filtering and Hilbert transform (in red), which confirms that the procedure properly captures the slow waves events (amplitude and phases). The bottom panels show the corresponding power spectrum.

